Introduction
Matplotlib is one of the most widely used data visualization libraries in Python. Much of Matplotlib's popularity comes from its customization options - you can tweak just about any element from its hierarchy of objects.
In this tutorial, we'll take a look at how to turn off a Matplotlib plot's axis. That is to say - how to turn off individual elements, such as tick labels, grid, ticks and individual spines, but also how to turn them all off as a group, collectivelly referred to as the axis.
Most of the approaches we'll be covering work the same for 2D and 3D plots - both the regular Axes and Axes3D classes have the same methods for this. For some, since 3D plots have more than two spines, they won't be the same.
Note: For the remainder of this guide, we'll be using a 3D plot, as this is a more common case where you might want to turn off the spines and ticks - and let the data speak for itself, as well as a 2D plot on the same dataset.
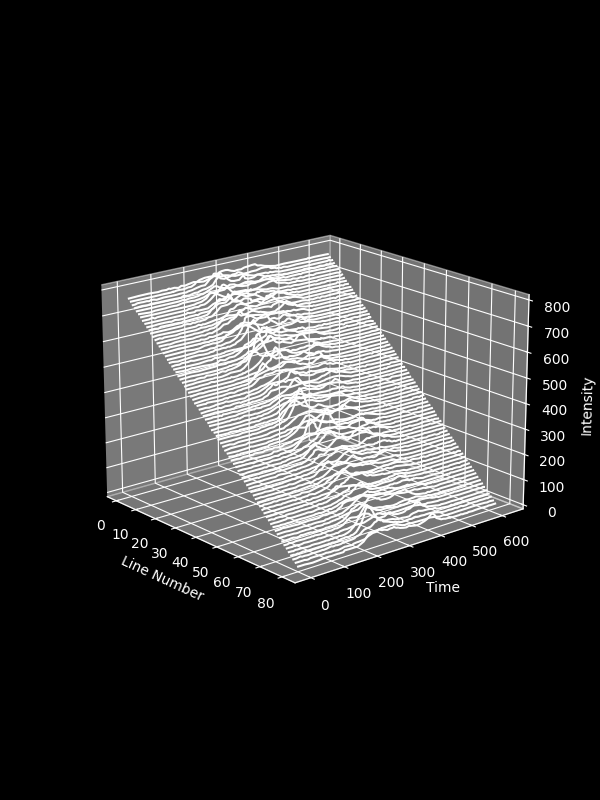
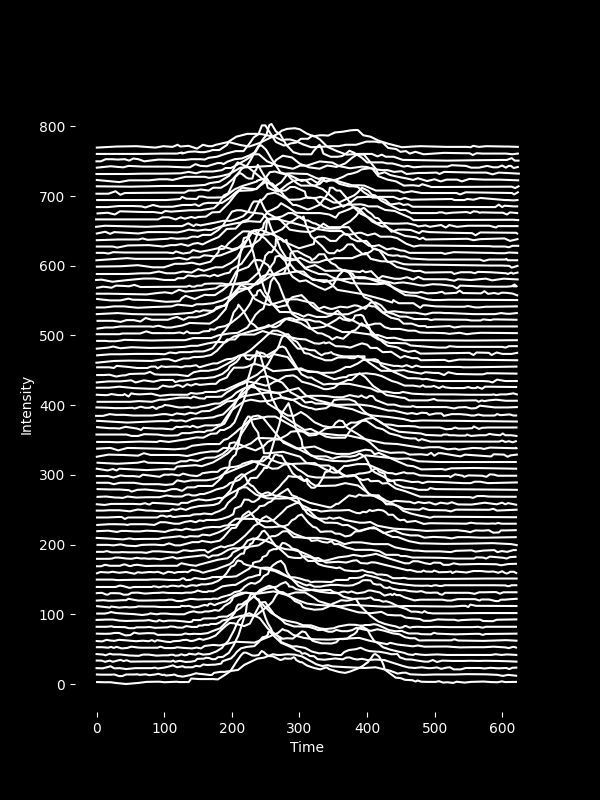
We'll specifically be using a recreation of the CP1919 pulsar's data, as discovered by Jocelyn Bell Burnell in 1967, visualized by by Harold D. Craft, Jr. in his PhD Thesis in 1970 and popularized by Peter Saville in 1979, when the English band Joy Division was on the lookout to release a new album - "Unknown Pleasures":
import pandas as pd
import matplotlib.pyplot as plt
from mpl_toolkits.mplot3d import Axes3D

df = pd.read_csv(r"https://raw.githubusercontent.com/StackAbuse/CP1919/master/data-raw/clean.csv")
groups = df.groupby(['line'])

plt.style.use('dark_background')

fig = plt.figure(figsize=(6, 8))

ax = fig.add_subplot(111, projection='3d')
ax.set_xlabel('Line Number')
ax.set_ylabel('Time')
ax.set_zlabel('Intensity')

for group in groups:
    line = ax.plot(group[1]['line'], group[1]['x'], group[1]['y'], color='white')

plt.show()
Which results in:
If you'd like to learn more about Ridge Plots (shown above), build a foundation in Matplotlib and explore advanced usage of the library, make sure to check out our Data Visualization in Python eBoook Bundle. This specific visualization is taken straight out of the book, from a longer section dedicated to this dataset and the history of the plot.
Now, let's take a look at how to remove the spines, tick labels, ticks, grid and axis labels.
Turning off the Axis with ax.axis('off')
The easiest way to turn off everything axis-related is via a convenience function - axis('off') on your Axes or Axes3D instance:
import pandas as pd
import matplotlib.pyplot as plt
from mpl_toolkits.mplot3d import Axes3D
# Load dataset in and set style...
fig = plt.figure(figsize=(6, 8))
ax = fig.add_subplot(111, projection='3d')
ax.set_xlabel('Line Number')
ax.set_ylabel('Time')
ax.set_zlabel('Intensity')
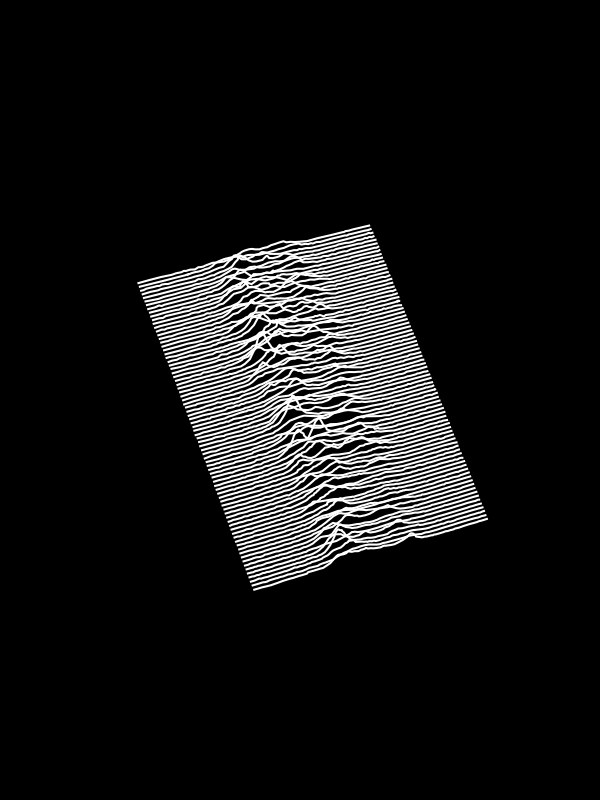
ax.axis('off')
for group in groups:
line = ax.plot(group[1]['line'], group[1]['x'], group[1]['y'], color='white')
plt.show()
Note: You can also use the axis('off') function on the plt instance if you're plotting using the MATLAB-style API. Though, this approach is discouraged if you're plotting using the OOP API like we are currently.
This change to the code results in a plot without the spines, axis lines, ticks, tick labels, axis labels and grid:

The axis() function is a convennience function to access various properties.
Turning off the Axis with ax.set_axis_off()
Alternatively, you can use the ax.set_axis_off() function, in conjecture with the ax.set_axis_on() function, which reverses the former's effects.
This is a very useful set of functions to use when updating plots, such as when animating them, or whenever you might want to turn the axis off and on, rather than just disabling it:\
import pandas as pd
import matplotlib.pyplot as plt
from mpl_toolkits.mplot3d import Axes3D
# Load dataset in and set style...
fig = plt.figure(figsize=(6, 8))
ax = fig.add_subplot(111, projection='3d')
ax.set_xlabel('Line Number')
ax.set_ylabel('Time')
ax.set_zlabel('Intensity')
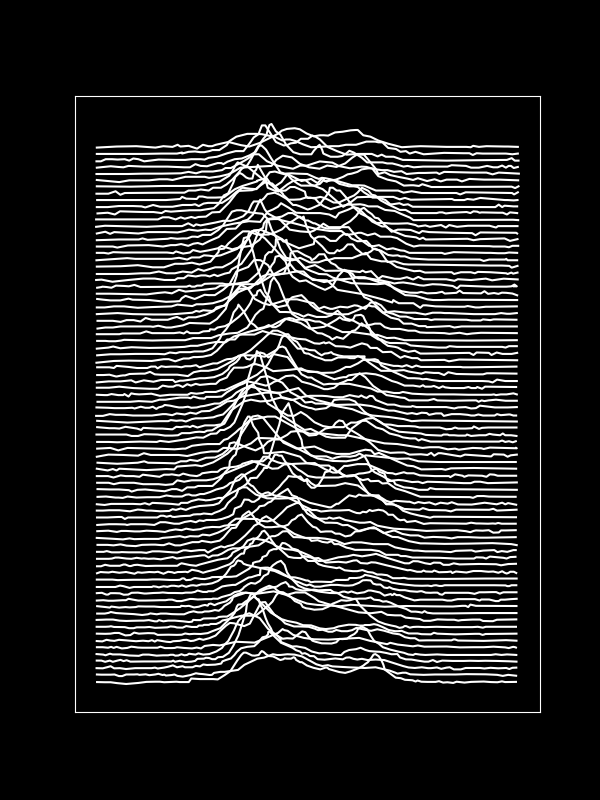
ax.set_axis_off()
for group in groups:
line = ax.plot(group[1]['line'], group[1]['x'], group[1]['y'], color='white')
plt.show()
This results in the exact same plot:
Turning off Ticks and Tick Labels on Axes
Instead of turning all of these elements off, and making them invisible, you can also turn them off individually if you'd like to keep some.
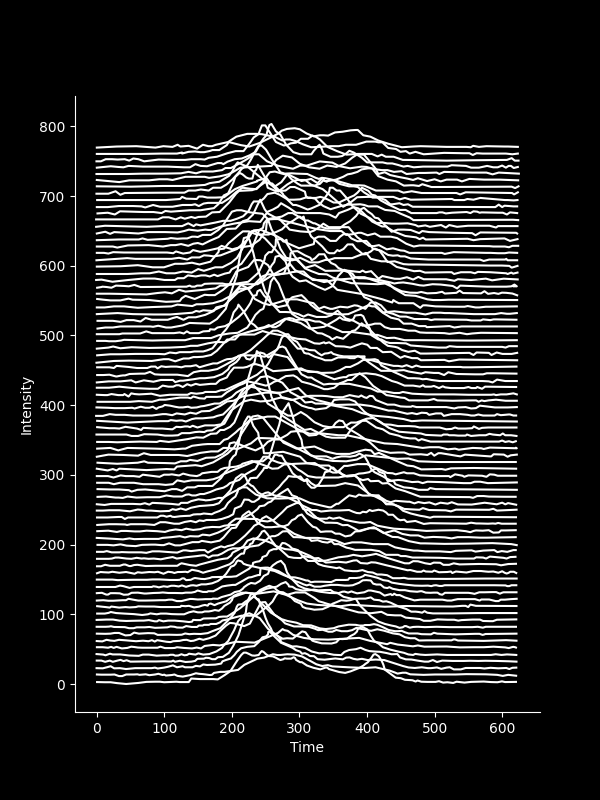
This is where we'll be switching back to a 2D plot, since some of these functions don't work with 3D plots, given the fact that they've got more than just the X-axis and Y-axis.
For example, you can turn off individual axes (ticks and tick labels). You can use the get_yaxis() or get_xaxis() to get the respective axes and turn them off by using set_visible(False):
import pandas as pd
import matplotlib.pyplot as plt

df = pd.read_csv(r"https://raw.githubusercontent.com/StackAbuse/CP1919/master/data-raw/clean.csv")
groups = df.groupby(['line'])

plt.style.use('dark_background')
fig = plt.figure(figsize=(6, 8))

ax = fig.add_subplot(111)
ax.set_xlabel('Time')
ax.set_ylabel('Intensity')

ax.get_xaxis().set_visible(False)
ax.get_yaxis().set_visible(False)

for group in groups:
    line = ax.plot(group[1]['x'], group[1]['y'], color='white')

plt.show()
This turns off the tick labels and ticks themselves, but leaves the frame (spines) on:
Turning off Individual Spines on an Axes
To turn the spines off - you can access them via the ax.spines dictionary. Using their keys, top, bottom, left, and right, you can select each one, and using the set_visible() function, turn them off.
Let's turn of the top and right spine:
import pandas as pd
import matplotlib.pyplot as plt

# Load data and stylize

fig = plt.figure(figsize=(6, 8))

ax = fig.add_subplot(111)
ax.set_xlabel('Time')
ax.set_ylabel('Intensity')

ax.spines['right'].set_visible(False)
ax.spines['top'].set_visible(False)
# To turn off the bottom or left
#ax.spines['bottom'].set_visible(False)
#ax.spines['left'].set_visible(False)

for group in groups:
    line = ax.plot(group[1]['x'], group[1]['y'], color='white')

plt.show()
This turns off the top and right spine, but leaves the bottom and left intact - as well as the ticks and their labels:
You can also iterate through them, and turn them all off:
for key, spine in ax.spines.items():
    spine.set_visible(False)
Conclusion
In this tutorial, we've gone over several ways to turn off the axis, as well as individual axis compoents in Matplotlib.
If you're interested in Data Visualization and don't know where to start, make sure to check out our bundle of books on Data Visualization in Python:
Data Visualization in Python with Matplotlib and Pandas is a book designed to take absolute beginners to Pandas and Matplotlib, with basic Python knowledge, and allow them to build a strong foundation for advanced work with theses libraries - from simple plots to animated 3D plots with interactive buttons.
It serves as an in-depth, guide that'll teach you everything you need to know about Pandas and Matplotlib, including how to construct plot types that aren't built into the library itself.
Data Visualization in Python, a book for beginner to intermediate Python developers, guides you through simple data manipulation with Pandas, cover core plotting libraries like Matplotlib and Seaborn, and show you how to take advantage of declarative and experimental libraries like Altair. More specifically, over the span of 11 chapters this book covers 9 Python libraries: Pandas, Matplotlib, Seaborn, Bokeh, Altair, Plotly, GGPlot, GeoPandas, and VisPy.
It serves as a unique, practical guide to Data Visualization, in a plethora of tools you might use in your career.
from Planet Python
via read more


No comments:
Post a Comment