Learning pandas sort methods is a great way to start with or practice doing basic data analysis using Python. Most commonly, data analysis is done with spreadsheets, SQL, or pandas. One of the great things about using pandas is that it can handle a large amount of data and offers highly performant data manipulation capabilities.
In this tutorial, you’ll learn how to use .sort_values() and .sort_index(), which will enable you to sort data efficiently in a DataFrame.
By the end of this tutorial, you’ll know how to:
- Sort a pandas DataFrame by the values of one or more columns
- Use the
ascendingparameter to change the sort order - Sort a DataFrame by its
indexusing.sort_index() - Organize missing data while sorting values
- Sort a DataFrame in place using
inplaceset toTrue
To follow along with this tutorial, you’ll need a basic understanding of pandas DataFrames and some familiarity with reading in data from files.
Free Bonus: Click here to get a Python Cheat Sheet and learn the basics of Python 3, like working with data types, dictionaries, lists, and Python functions.
Getting Started With Pandas Sort Methods
As a quick reminder, a DataFrame is a data structure with labeled axes for both rows and columns. You can sort a DataFrame by row or column value as well as by row or column index.
Both rows and columns have indices, which are numerical representations of where the data is in your DataFrame. You can retrieve data from specific rows or columns using the DataFrame’s index locations. By default, index numbers start from zero. You can also manually assign your own index.
Preparing the Dataset
In this tutorial, you’ll be working with fuel economy data compiled by the US Environmental Protection Agency (EPA) on vehicles made between 1984 and 2021. The EPA fuel economy dataset is great because it has many different types of information that you can sort on, from textual to numeric data types. The dataset contains eighty-three columns in total.
To follow along, you’ll need to have the pandas Python library installed. The code in this tutorial was executed using pandas 1.2.0 and Python 3.9.1.
Note: The whole fuel economy dataset is around 18 MB. Reading the entire dataset into memory could take a minute or two. Limiting the number of rows and columns will help performance, but it will still take a few seconds before the data is downloaded.
For analysis purposes, you’ll be looking at MPG (miles per gallon) data on vehicles by make, model, year, and other vehicle attributes. You can specify which columns to read into your DataFrame. For this tutorial, you’ll need only a subset of the available columns.
Here are the commands to read the relevant columns of the fuel economy dataset into a DataFrame and to display the first five rows:
>>> import pandas as pd

>>> column_subset = [
...     "id",
...     "make",
...     "model",
...     "year",
...     "cylinders",
...     "fuelType",
...     "trany",
...     "mpgData",
...     "city08",
...     "highway08"
... ]

>>> df = pd.read_csv(
...     "https://www.fueleconomy.gov/feg/epadata/vehicles.csv",
...     usecols=column_subset,
...     nrows=100
... )

>>> df.head()
   city08  cylinders fuelType  ...  mpgData            trany  year
0      19          4  Regular  ...        Y     Manual 5-spd  1985
1       9         12  Regular  ...        N     Manual 5-spd  1985
2      23          4  Regular  ...        Y     Manual 5-spd  1985
3      10          8  Regular  ...        N  Automatic 3-spd  1985
4      17          4  Premium  ...        N     Manual 5-spd  1993
[5 rows x 10 columns]
By calling .read_csv() with the dataset URL, you’re able to load the data into a DataFrame. Narrowing down the columns results in faster load times and lower memory use. To further limit memory consumption and to get a quick feel for the data, you can specify how many rows to load using nrows.
Getting Familiar With .sort_values()
You use .sort_values() to sort values in a DataFrame along either axis (columns or rows). Typically, you want to sort the rows in a DataFrame by the values of one or more columns:
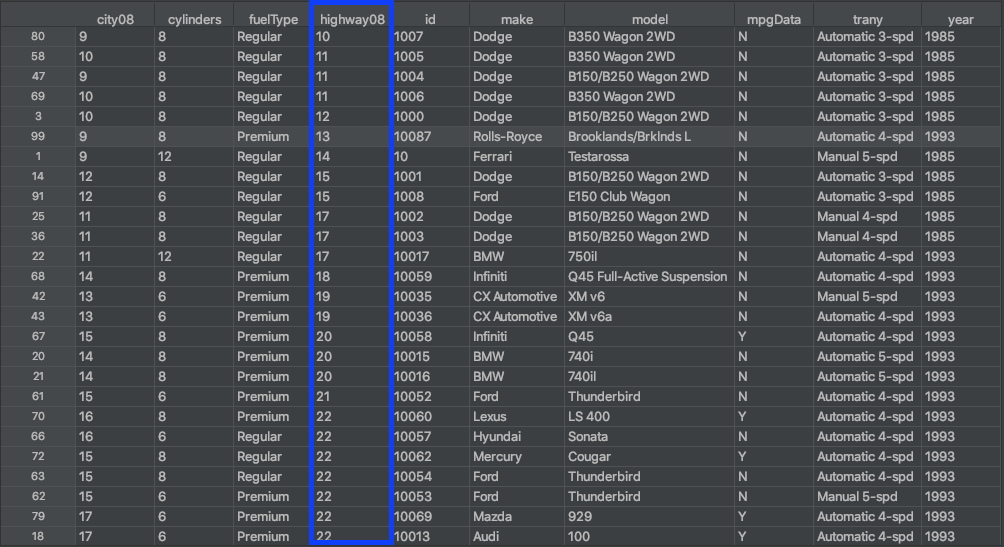
The figure above shows the results of using .sort_values() to sort the DataFrame’s rows based on the values in the highway08 column. This is similar to how you would sort data in a spreadsheet using a column.
Getting Familiar With .sort_index()
You use .sort_index() to sort a DataFrame by its row index or column labels. The difference from using .sort_values() is that you’re sorting the DataFrame based on its row index or column names, not by the values in these rows or columns:
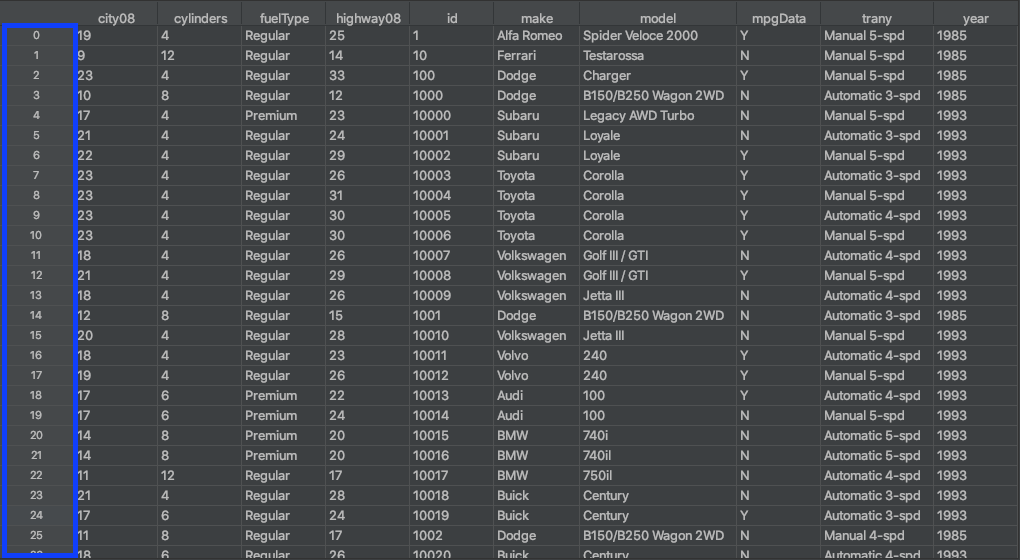
The row index of the DataFrame is outlined in blue in the figure above. An index isn’t considered a column, and you typically have only a single row index. The row index can be thought of as the row numbers, which start from zero.
Read the full article at https://realpython.com/pandas-sort-python/ »
[ Improve Your Python With 🐍 Python Tricks 💌 – Get a short & sweet Python Trick delivered to your inbox every couple of days. >> Click here to learn more and see examples ]
from Planet Python
via read more


No comments:
Post a Comment