Hello programmers, in today’s article, we will discuss the Matplotlib grid() in Python. Grids are made up of intersecting straight or curved lines used to structure our content. Matplotlib is a numerical – mathematical extension for the NumPy library. And Pyplot module of the Matplotlib library provides a MATLAB-like interface that helps plot graphs. Matplotlib.pyplot.grid() gives a reference for our data points for better understanding. Thus, Matplotlib library provides a grid() function for easy configuration of gridlines with various customization methods. Before we look into the Matplotlib grid’s implementations, let me brief you on its syntax and parameters.
Syntax of Matplotlib grid()
matplotlib.pyplot.grid(b=None, which='major', axis='both', \*\*kwargs)Parameters
- b: Parameter deciding whether to show the grid lines. It’s either bool or None (optional). If any kwargs are supplied, the grid is assumed, and b will be set to True. If b is None and there are no kwargs, this toggles the visibility of the lines.
- Which: The grid lines to apply the changes on. It may be ‘major’, ‘minor’, ‘both’. (optional)
- axis: The axis to apply the changes. It may be ‘both’, ‘x’, ‘y’. (optional)
- **kwargs: Define the line properties of the grid-like color, linestyle, linewidth, etc.
Return type
The matplotlib.pyplot.grid() function returns a grid lines created as per the programmer’s choice of input parameters.
Example of Matplotlib grid() in Python
import matplotlib.pyplot as plt
import numpy as np

# dummy data
x1 = np.linspace(0.0, 5.0)
y1 = np.cos(2 * np.pi * x1) * np.exp(-x1)

# creates two subplots
fig, (ax1, ax2) = plt.subplots(1, 2, figsize = (12, 5))

# Plot without grid
ax1.plot(x1, y1)
ax1.set_title('Plot without grid')

# plot with grid
ax2.plot(x1, y1)
ax2.set_title("Plot with grid")

# draw gridlines
ax2.grid(True)

plt.show()
Output:

Explanation:
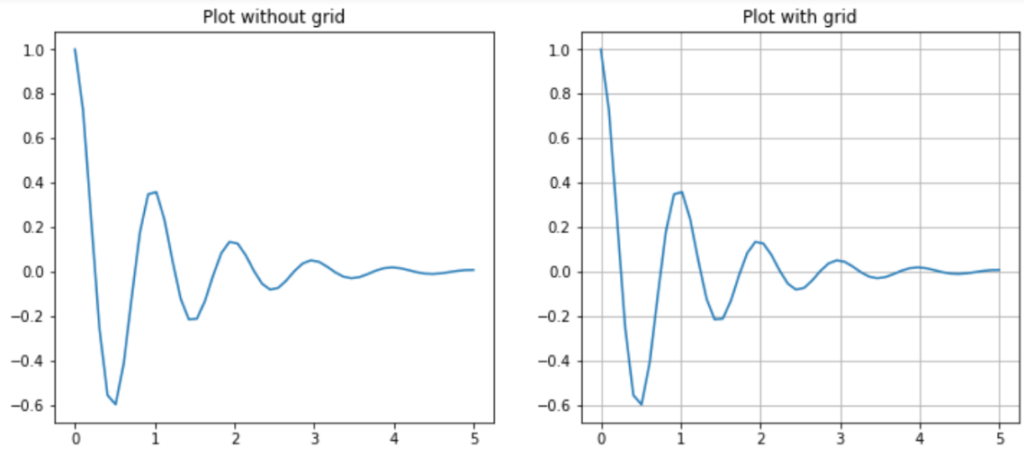
In the above example, two subplots, ‘ax1’ and ‘ax2’are created depending upon the input data values. The grid() function sets the grids’ visibility by specifying a boolean value (True/False). For the second plot, ax2.grid(True) is set, which returns grid lines for the second plot. Whereas ‘True’ is not specified in the grid() function for the first plot, there are no grid lines.
Matplotlib grid() in Python with Customizations
import matplotlib.pyplot as plt
import numpy as np

# dummy data
x = np.linspace(0, 2 * np.pi, 400)
y = np.sin(x ** 2)

# set graph color
plt.plot(x, y, 'green')

# to set title
plt.title("Plot with linewidth and linestyle")

# draws gridlines of grey color using given
# linewidth and linestyle
plt.grid(True, color = "grey", linewidth = "1.4", linestyle = "-.")

plt.show()
Output:

Explanation:
In the above example, the plt.grid() is set to ‘True,’ which returns grid lines for the plot created. The grid lines are customized using line properties like lie color, width, style, etc. These line properties are passed as ** kwargs parameters to the Matplotlib grid() function. Here, color is set to ‘Grey,’ line width is set to ‘1.4,’ and line style is set to ‘-.’ These color, line width, and line style parameters are passed as arguments to the plt.grid() function, which returns customized gridlines.
Grid lines to only one axis
import matplotlib.pyplot as plt

#create data
x = [1, 2, 3, 4, 5]
y = [20, 25, 49, 88, 120]

#create scatterplot of data with gridlines
plt.scatter(x, y)
plt.grid(axis='x')
plt.show()
Output:

Explanation:
In the above example, gridlines are created only along the x-axis using the ‘axis’ argument with the plt.grid() function. The axis argument is set to ‘x’ in the Matplotlib grid function, which returns gridlines in the plot only along the x-axis. Similarly, to get gridlines only along the y-axis, the axis parameter is set to ‘y’.
Major and Minor Matplotlib grid() in Python
import matplotlib.pyplot as plt

# The Data
x = [1, 2, 3, 4]
y = [234, 124,368, 343]

# Create the figure and axes objects
fig, ax = plt.subplots(1, figsize=(8, 6))
fig.suptitle('Example Of Plot With Major and Minor Grid Lines')

# Plot the data
ax.plot(x,y)

# Show the major grid lines with dark grey lines
plt.grid(b=True, which='major', color='#666666', linestyle='-')

# Show the minor grid lines with very faint and almost transparent grey lines
plt.minorticks_on()
plt.grid(b=True, which='minor', color='#999999', linestyle='-', alpha=0.2)

plt.show()
Output:

Explanation:
In the above example, the ‘which’ parameter is passed as ‘major’ to one grid() function. The major grid lines created are customized by setting color like dark grey and linestyle as ‘ -. ‘ The ‘which’ parameter is set to ‘minor’ in the second plt.grid() function returning minor gridlines inside the major ones. The minor gridlines are also customized using color and linestyle parameters.
Must Read
- Matplotlib Vertical Lines in Python With Examples
- Numpy Axis in Python With Detailed Examples
- Matplotlib Errorbar For Lines and Graphs
- Matplotlib Boxplot With Customization in Python
Conclusion
In this article, we have discussed the Matplotlib gridlines in detail. Grid Lines has many attributes like plotting along one axis, customization, minor and major gridlines, etc. In this tutorial, we tried to cover the basic concept and code flow for gridlines and a proper explanation. We have also covered its syntax and examples associated with it. Refer to this article in case of any doubt regarding the Matplotlib grid() in Python.
However, if you have any doubts or questions, do let me know in the comment section below. I will try to help you as soon as possible.
Happy Pythoning!
The post Matplotlib grid With Attributes in Python appeared first on Python Pool.
from Planet Python
via read more
No comments:
Post a Comment