Hello programmers, in today’s article, we learn about the Matplotlib errorbar in Python. The Pyplot module of the Matplotlib library provides MATLAB like interface. And the matplotlib.pyplot.errorbar() function is used to plot y versus x as lines and/or markers with attached errorbars. Error bars help to indicate estimated error or uncertainty to give a general sense of how precise a measurement is; this is done through the use of markers drawn over the original graph and its data points. Before we look into examples of Matplotlib errobars and errorbar graphs, let me brief you with the syntax and return the same.
Syantax of matplotlib errorbar()
matplotlib.pyplot.errorbar(x, y, yerr=None, xerr=None, fmt=”, ecolor=None, elinewidth=None, capsize=None, barsabove=False, lolims=False, uplims=False, xlolims=False, xuplims=False, errorevery=1, capthick=None, \*, data=None, \*\*kwargs)Parameters of Matplotlib Errorbar:
x, y: The horizontal and vertical coordinates of the data points.
fmt: Contains the string value (Optional)
xerr, yerr: An array containing errors, and the errors must be positive values.
ecolor: (default: NONE)Color of the errorbar lines. (Optional)
elinewidth: Linewidth of the errorbar lines with default value NONE. (Optional)
capsize: Length of the error bar caps in points with default value NONE. (Optional)
barsabove: (default: False)Contains boolean values for plotting error bars above the plot symbols. (Optional)
lolims, uplims, xlolims, xuplims: Contains boolean values, which indicate that a value gives only upper/lower limits. (Optional) errorevery: Contain integer values that help draws error bars on a subset of the data. (Optional)
Return type of Matplotlib Errorbar:
The Matplotlib errorbar() function returns a container having:
plotline: Line2D instance of x, y plot markers and/or line.
caplines: Tuple of Line2D instances of the error bar caps.
barlinecols: Tuple of LineCollection with the horizontal and vertical error ranges.
Example of Matplotlib Errorbar in Python
import numpy as np
import matplotlib.pyplot as plt
xval = np.arange(0.1, 4, 0.5)
yval = np.exp(-xval)
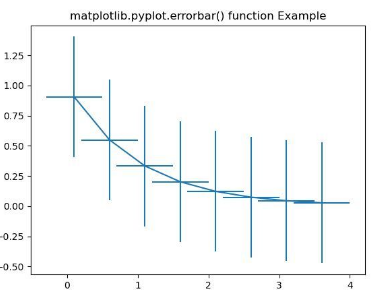
plt.errorbar(xval, yval, xerr = 0.4, yerr = 0.5)
plt.title('matplotlib.pyplot.errorbar() function Example')
plt.show()
OUTPUT:
EXPLANATION:
The above example is a fundamental implementation of the Matplotlib errorbar() function. The ‘xval’ and ‘yval’ contains the horizontal and vertical coordinates of the data points required for errorbar plotting. The ‘xerr’ and ‘yerr’ are also passed as arguments to the errorbar function. The values assigned to them are 0.4 and 0.5, respectively, which are the positive error values. These four parameters passed to the errorbar() function are mandatory arguments required to plot any errorbars in Python.
Matplotlib Errorbar in Python Multiple lines
import numpy as np
import matplotlib.pyplot as plt

fig = plt.figure()
x = np.arange(10)
y = 3 * np.sin(x / 20 * np.pi)
yerr = np.linspace(0.05, 0.2, 10)

plt.errorbar(x, y + 7, yerr = yerr,
             label ='Line1')
plt.errorbar(x, y + 5, yerr = yerr,
             uplims = True,
             label ='Line2')
plt.errorbar(x, y + 3, yerr = yerr,
             uplims = True,
             lolims = True,
             label ='Line3')

upperlimits = [True, False] * 5
lowerlimits = [False, True] * 5
plt.errorbar(x, y, yerr = yerr,
             uplims = upperlimits,
             lolims = lowerlimits,
             label ='Line4')

plt.legend(loc ='upper left')

plt.title('matplotlib.pyplot.errorbar()\
function Example')
plt.show()
OUTPUT:
EXPLANATION:
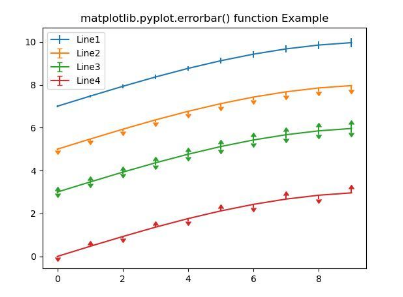
In the above example, the matplotlib errorbar() function is used multiple times to plot multiple errorbar lines. The x and y defined are the coordinates of the data points. Errors are added only along the y-axis. Hence only ‘yerr’ is specified for each line. The upper and lower limits are specified, indicating the values give only upper and lower limits. Also, the label is passed as an argument indicating the lines as Line1, Line2, etc.
Errorbar graph with error in x
import matplotlib.pyplot as plt

# making a simple plot
x =[1, 2, 3, 4, 5, 6, 7]
y =[1, 2, 1, 2, 1, 2, 1]

# creating error
x_error = 0.5

# ploting graph
plt.plot(x, y)
plt.errorbar(x, y,
             xerr = x_error,
             fmt ='o')
OUTPUT:
EXPLANATION:
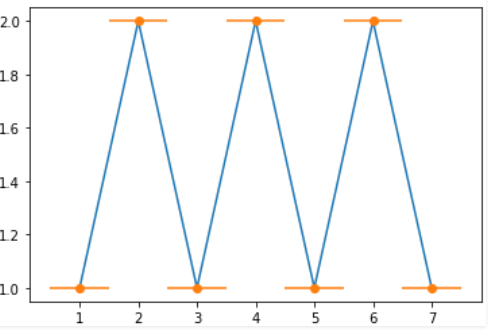
In the above example, x and y are arrays defined containing x and y coordinates to plot the graph. The ‘x_error’ is set to 0.5, which introduces errors only along the x-axis. The x, y, and xerr are the mandatory parameters passed to the Matplotlib errorbar in Python. The optional parameter ‘fmt’ containing string value is also passed.
Errorbar graph with error in y
import matplotlib.pyplot as plt


# making a simple plot
x =[1, 2, 3, 4, 5, 6, 7]
y =[1, 2, 1, 2, 1, 2, 1]

# creating error
y_error = 0.2

# ploting graph
plt.plot(x, y)

plt.errorbar(x, y,
             yerr = y_error,
             fmt ='o')
OUTPUT:
EXPLANATION:
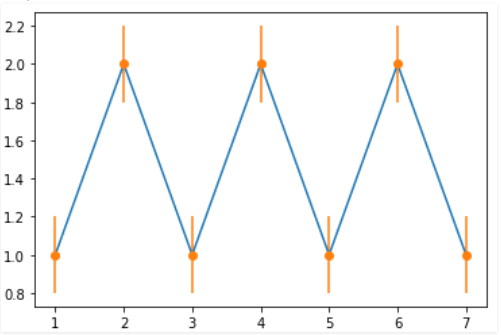
In the above example, x and y are arrays defined containing x and y coordinates to plot the graph. The ‘y_error’ is set to 0.2, which introduces errors only along the y-axis. The x, y, and yerr are the mandatory parameters passed to the errorbar function. The optional parameter ‘fmt’ containing string value is also passed.
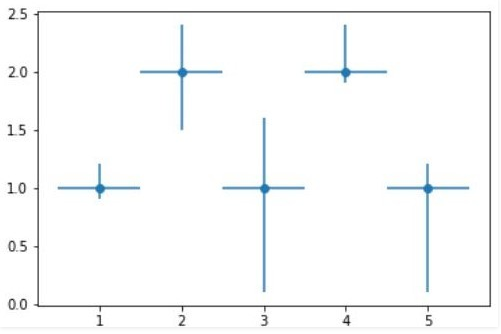
Errorbar graph with Variable error in x and y
import matplotlib.pyplot as plt

x =[1, 2, 3, 4, 5]
y =[1, 2, 1, 2, 1]

y_errormin =[0.1, 0.5, 0.9,
             0.1, 0.9]
y_errormax =[0.2, 0.4, 0.6,
             0.4, 0.2]

x_error = 0.5
y_error =[y_errormin, y_errormax]

# ploting graph
# plt.plot(x, y)
plt.errorbar(x, y,
             yerr = y_error,
             xerr = x_error,
             fmt ='o')
OUTPUT:
EXPLANATION:
The above example depicts an errrorbar graph plot for variable errors. The x and y are two arrays defined containing the coordinate points. The error along the x-axis is set as 0.5. Simultaneously, the error along the y-axis is varied between two arrays defined as y_errormin and y_errormax. These parameters are passed as arguments to the Matplotlib errorbar function to get the desired output.
Conclusion
This article clearly presents to you different ways of using the Matplotlib errorbar in Python. Examples of both errorbar lines and graphs are provided with a detailed explanation. Errorbars are also applied to graphs to provide an additional layer of detail on the presented data. Refer to this article for any queries related to the Matplotlib errorbar() function.
However, if you have any doubts or questions, do let me know in the comment section below. I will try to help you as soon as possible.
Happy Pythoning!
The post Matplotlib Errorbar For Lines and Graphs appeared first on Python Pool.
from Planet Python
via read more


No comments:
Post a Comment