Everyone makes mistakes—even seasoned professional developers! Python’s interactive interpreter, IDLE, is pretty good at catching mistakes like syntax errors and runtime errors, but there’s a third type of error that you may have already experienced. Logic errors occur when an otherwise valid program doesn’t do what was intended. Logic errors cause unexpected behaviors called bugs. Removing bugs is called debugging.
A debugger is a tool that helps you hunt down bugs and understand why they’re happening. Knowing how to find and fix bugs in your code is a skill that you’ll use for your entire coding career!
In this tutorial, you’ll:
- Learn how to use IDLE’s Debug Control window
- Practice debugging on a buggy function
- Learn alternative methods for debugging your code
Note: This tutorial is adapted from the chapter “Finding and Fixing Code Bugs” in Python Basics: A Practical Introduction to Python 3.
The book uses Python’s built-in IDLE editor to create and edit Python files and interact with the Python shell, so you will see references to IDLE’s built-in debugging tools throughout this tutorial. However, you should be able to apply the same concepts to the debugger of your choice.
Free Bonus: 5 Thoughts On Python Mastery, a free course for Python developers that shows you the roadmap and the mindset you'll need to take your Python skills to the next level.
Use the Debug Control Window#
The main interface to IDLE’s debugger is the Debug Control window, or the Debug window for short. You can open the Debug window by selecting Debug→Debugger from the menu in the interactive window. Go ahead and open the Debug window.
Note: If the Debug menu is missing from your menu bar, then make sure to bring the interactive window into focus by clicking it.
Whenever the Debug window is open, the interactive window displays [DEBUG ON] next to the prompt to indicate that the debugger is open. Now open a new editor window and arrange the three windows on your screen so that you can see all of them simultaneously.
In this section, you’ll learn how the Debug window is organized, how to step through your code with the debugger one line at a time, and how to set breakpoints to help speed up the debugging process.
The Debug Control Window: An Overview#
To see how the debugger works, you can start by writing a simple program without any bugs. Type the following into the editor window:
 1 for i in range(1, 4):
 2     j = i * 2
 3     print(f"i is {i} and j is {j}")
Save the file, then keep the Debug window open and press F5. You’ll notice that execution doesn’t get very far.
The Debug window will look like this:
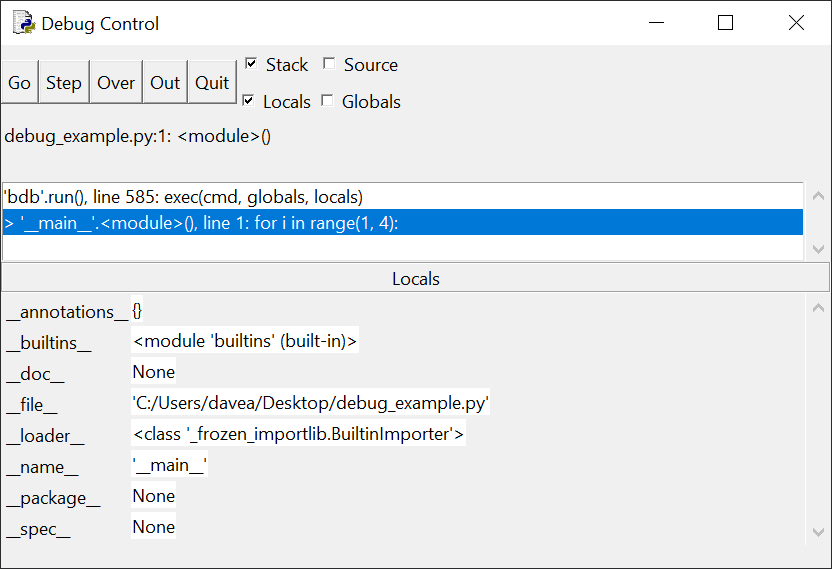
Notice that the Stack panel at the top of the window contains the following message:
> '__main__'.<module>(), line 1: for i in range(1, 4):
This tells you that line 1 (which contains the code for i in range(1, 4):) is about to be run but hasn’t started yet. The '__main__'.module() part of the message refers to the fact that you’re currently in the main section of the program, as opposed to being, for example, in a function definition before the main block of code has been reached.
Below the Stack panel is a Locals panel that lists some strange looking stuff like __annotations__, __builtins__, __doc__, and so on. These are internal system variables that you can ignore for now. As your program runs, you’ll see variables declared in the code displayed in this window so that you can keep track of their value.
There are five buttons located at the top left-hand corner of the Debug window: Go, Step, Over, Out, and Quit. These buttons control how the debugger moves through your code.
In the following sections, you’ll explore what each of these buttons does, starting with Step.
The Step Button#
Go ahead and click Step at the top left-hand corner of the Debug window. The Debug window changes a bit to look like this:
Read the full article at https://realpython.com/python-debug-idle/ »
[ Improve Your Python With 🐍 Python Tricks 💌 – Get a short & sweet Python Trick delivered to your inbox every couple of days. >> Click here to learn more and see examples ]
from Real Python
read more


No comments:
Post a Comment