The post How to Perform a Two-Sample T-test with Python: 3 Different Methods appeared first on Erik Marsja.
In this Python tutorial, you will learn how to perform a two-sample t-test with Python. First, you will learn about the t-test including the assumptions of the statistical test. Following this, you will learn how to check whether your data follow the assumptions.
After this, you will learn how to perform an two sample t-test using the following Python packages:
- Scipy (scipy.stats.ttest_ind)
- Pingouin (pingouin.ttest)
- Statsmodels (statsmodels.stats.weightstats.ttest_ind)
- Interpret and report the two-sample t-test
- Including effect sizes
Finally, you will also learn how to interpret the results and, then, how to report the results (including data visualization).
Prerequisites
Obviously, before learning how to calculate an independent t-test in Python, you will have at least one of the packages installed. Make sure that you have the following Python packages installed:
- Scipy
- Pandas
- Seaborn
- Pingouin (if using pingouin.ttest)
- Statsmodels (if using statsmodels.stats.weightstats.ttest_ind)
Scipy
Scipy is an essential package for data analysis in Python and is, in fact, a dependency of all of the other packages used in this tutorial. In this post, we will use it to test one of the assumptions using the shapiro-wilks test. Thus, you will need Scipy even though you use one of the other packages to calculate the t-test. Now, you might wonder why you should bother using any of the other packages for your analysis. Well, the ttest_ind function will return the t- and p-value whereas (some) of the other packages will return more values (e.g., the degrees of freedom, confidence interval, effect sizes) as well.
Pandas
Pandas will be used to import data into a dataframe and to calculate summary statistics. Thus, you will need this package to follow this tutorial.
Seaborn
If you want to visualize the different means and learn how to plot the p-values and effect sizes Seaborn is a very easy data visualization package.
Pingouin
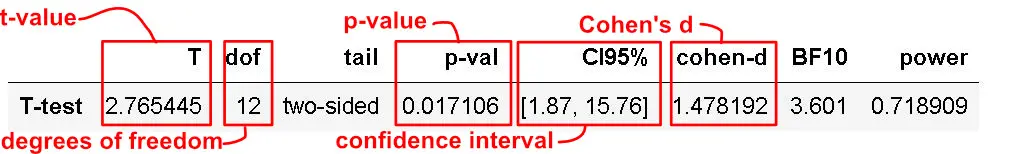
This is the second package used, in this tutorial, to calculate the t-test. One neat thing with the ttest function, of the Pingouin package, is that it returns a lot of information we need when reporting the results from the statistical analysis. For example, using Pingouin we also get the degrees of freedom, Bayes Factor, power, effect size (Cohen’s d), and confidence interval.
Statsmodels
Statsmodels is the third, and last package, used to carry out the independent samples t-test. You do not have to use and, thus, this package is not required for the post. It does, however, contrary to Scipy, also return the degrees of freedom in addition to the t- and p-values.
Installing the Needed Python Packages
Now, if you don’t have the required packages they can be installed using either pip or conda (if you are using Anaconda). Here’s how to install Python packages with pip:
pip install scipy numpy seaborn pandas statsmodels pingouinIf pip is telling you that there is a newer version, you can learn how to upgrade pip.
 Using Pip to Install all Packages
If you are using Anaconda here’s how to create a virtual environment and install the needed packages:
conda create -n 2sampttest
conda activate 2sampttest
conda install scipy numpy pandas seaborn statsmodels pingouin
Obviously, you don’t have to install all the prerequisites of this post and you can refer to the post about installing Python packages if you need more information about the installation process.
Two Sample T-test
The two sample t-test is also known as the independent samples, independent, and unpaired t-test. Moreover, this type of statistical test compares two averages (means) and will give you information if these two means are statistically different from each other. The t-test also tells you whether the differences are statistically significant. In other words it lets you know if those differences could have happened by chance.
Example: clinical psychologists may want to test a treatment for depression to find out if the treatment will change the quality of life. In an experiment, a control group (e.g., a group who are given a placebo, or “sugar pill”, or in this case no treatment) is always used. The control group may report that their average quality of life is 3, while the group getting the new treatment might report a quality of life of 5. It would seem that the new treatment might work. However, it could be due to a fluke. In order to test this, the clinical researchers can use the two-sample t-test.
Hypotheses
Now, when performing t-tests you typically have the following two hypotheses:
- Null hypotheses: Two group means are equal
- Alternative hypotheses: Two group means are different (two-tailed)
Now, sometimes we also may have a specific idea about the direction of the condition. That is, we may, based on theory, assume that the condition one group is exposed to will lead to better performance (or worse). In these cases, the alternative hypothesis will be something like: the mean of one group either greater or lesser than another group (one-tailed).
Assumptions
Now, besides that the dependent variables are interval/ratio, and are continuous, there are three assumptions that need to be met.
- Assumption 1: Are the two samples independent?
- Assumption 2: Are the data from each of the 2 groups following a normal distribution?
- Assumption 3: Do the two samples have the same variances (Homogeneity of Variance)?
Example Data
First, before going on to the two-samples t-test examples, we need some data to work with. In this blog post, we are going to work with data that can be found here. Furthermore, here we will import data from an Excel (.xls) file directly from the URL.
Importing Data from CSV
import pandas as pd

data = 'https://gist.githubusercontent.com/baskaufs/1a7a995c1b25d6e88b45/raw/4bb17ccc5c1e62c27627833a4f25380f27d30b35/t-test.csv'
df = pd.read_csv(data)

df.head()
In the code chunk above, we first imported pandas as pd. Second, we created a string with the URL to the .csv file. In the fourth row, we used Pandas read_csv to load the .csv file into a dataframe. Finally, we used the .head() method to print the first five rows:
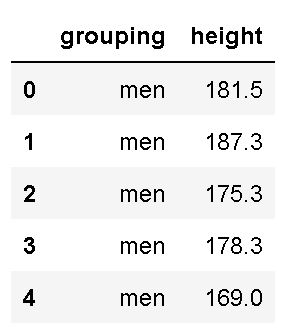 Example Dataframe
As can be seen in the image above, we have two columns (grouping and height). Luckily, the column names are eas to work with when we, later, are going to subset the data. If we, on the other hand, had long column names renaming columns in the Pandas dataframe would be wise.
Subsetting the Data
Finally, before calculating some descriptive statistics, we will subset the data. In the code below, we use the query method to create two Pandas series objects:
# Subset data
male = df.query('grouping == "men"')['height']
female = df.query('grouping == "women"')['height']
In the code chunk above, we first subset the rows containing men, in the column grouping. Subsequently, we do the exact same thing for the rows containing women. Note, that we are also selecting only the column named ‘height’ (i.e., the string within the brackets). Now, using the brackets and the column name as a string is one way to select columns in Pandas dataframe. Finally, if you don’t know the variable names, see the post How to Get the Column Names from a Pandas Dataframe – Print and List, for more information on how to get this information.
Descriptive Statistics
Now, we are going to use the groupby method together with the describe method to calculate summary statistics. Note, that here we use the complete dataframe:
df.groupby('grouping').describe()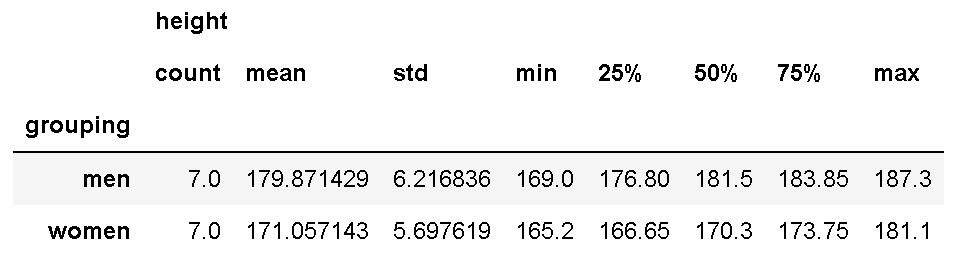
As we are interested in the difference between ‘A’ and ‘B’, in the dataset, we used ‘grouping’ as input to the groupby method. If you are interested in learning more about grouping data and calculating descriptive statistics in Python, see the following two posts:
In the next section, you will finally learn how to carry out a two-samples t-test with Python.
How to Check the Assumptions of the Two-Samples T-test in Python
In this section, we will cover how to check the assumptions of the independent samples t-test. Of course, we are only going to check assumption 2 and 3. That is, we will start by checking whether the data from the two groups are following a normal distribution (assumption 2). Second, we will check whether the two populations have the same variance.
Checking the Normality of Data
There are several methods to check whether our data is normally distributed. Here, we will use the Shapiro-Wilks test. Here’s how to examine if the data follow the normal distribution in Python:
stats.shapiro(male)
# Output: (0.9550848603248596, 0.7756242156028748)

stats.shapiro(female)
# Output: (0.9197608828544617, 0.467536598443985)
In the code chunk above, we performed the Shapiro-Wliks test on both Pandas series (i.e., for each group seperately). Consequently, we get a tuple, for each time we use the shapiro method. This tuple contains the test statistics and the p-value. Here, the null hypothesis is that the data follows a normal distribution. Thus, we can infer that the data from both groups is normally distributed.
Now, there are of course other tests, see this excellent overview, for information. Finally, it is also worth noting that most statistical tests for normality is sensitive for large samples. Normality can also be explored visually using histograms, q-q plots, to name a few. See the post How to Plot a Histogram with Pandas in 3 Simple Steps.
Checking the Homogeneity of Variance Assumption in Python
We’ll use Levene’s test to test for homogeneity of variances (equal variances) and this can be performed with the function levene as follow:
stats.levene(male, female)

# Output: LeveneResult(statistic=0.026695150465104206, pvalue=0.8729335280501348)
Again, the p-value suggests that the data follows the assumption of equal variance. See this article for more information. Here are some options to Levene’s test of homogeneity:
It is worth noting here, that if our data does not fulfill the assumption of equal variance, we can use Welch’s t-test instead of Student’s t-test. See the references at the end of the post.
How to Carry Out a Two-Samples T-test in Python in 3 Ways
In this section, we are going to learn how to perform an independent samples t-test with Python. To be more exact, we will cover three methods: using SciPy, Pingouin, and Statsmodels. First, we will use SciPy:
1 T-test with SciPy
Here’s how to carry out a two-samples t-test using SciPy:
res = stats.ttest_ind(male, female,
                      equal_var=True)

display(res)
In the code chunk above, we used the ttest_ind method to carry out the independent samples t-test. Here, we used the Pandas series’ we previously created (subsets), and set the equal_var parameter to True. If we, on the other hand, have data that is violating the second assumption (equal variances) we should set the equal_var parameter to False.
2 Two-Samples T-Test with Pingouin
To carry out a t-test using the Python package Pingouin you just do as follows:
import pingouin as pg

res = pg.ttest(male, female, correction=False)
display(res)
In the code chunk above, we started by importing pingouin as pg. Following this, we carried out the statistical analysis (i.e., using the ttest method). Noteworthy, here we set the correction to False as we want to carry out Student’s t-test. If the data were violating the homogeneity assumption, we should set the correction to True. This way we would carry out the Welch’s T-test instead.
3 T-test with Statsmodels
Finally, if you prefer to use the Statsmodels package here’s how to carry out an independent samples t-test:
from statsmodels.stats.weightstats import ttest_ind


ttest_ind(male, female)
In the code chunk above, we imported the ttest_ind method to carry out our data analysis. All the three methods, described in this post, requires that you already have imported Pandas and used it to load your dataset.
How to Interpret the Results from a T-test
In this section, you are briefly going to learn how to interpret the results from the two-samples t-test carried out with Python. Furthermore, this section will focus on the results from Pingouin and Statsmodels as they give us a more rich output (e.g., degrees of freedom, effect size). Finally, following this section you will further learn how to report the t-test according to the guidelines of American Psychological Association.
Interpreting the P-value
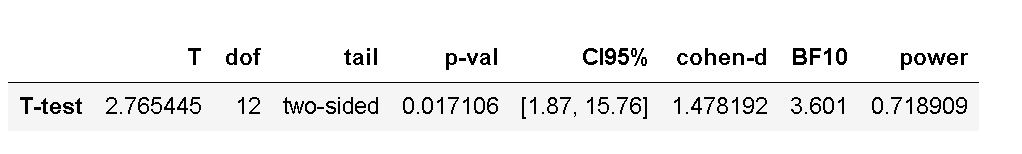
Now, the p-value of the test is 0.017106, which is less than the significance level alpha (e.g., 0.05). Furthermore, this means that we can conclude that the men’s average height is statistically different from the female’s average height.
Specifically, a p-value is a probability of obtaining an effect at least as extreme as the one in the data you have obtained (i.e., your sample), assuming that the null hypothesis is true. Moreover, p-values address only one question which is concerned about how likely your collected data is, assuming a true null hypothesis? Importantly, it cannot be used as support for the alternative hypothesis.
Interpreting the Effect Size (Cohen’s D)
One common way to interpret Cohen’s D that is obtained in a t-test is in terms of the relative strength of e.g. the condition. Cohen (1988) suggested that d=0.2 should be considered a ‘small’ effect size, 0.5 is a ‘medium’ effect size, and that 0.8 is a ‘large’ effect size. This means that if two groups’ means don’t differ by 0.2 standard deviations or more, the difference is trivial, even if it is statistically significant.
Interpreting the Bayes Factor from Pingouin
Now, if you used Pingouin to carry out the two-sample t-test you might have noticed that we also get the Bayes Factor. See this post for more information.
Reporting the Results
In this section, you will learn how to report the results according to the APA guidelines. In our case, we can report the results from the t-test like this:
There was a significant difference in height for men (M = 179.87, SD = 6.21) and women (M = 171.05, SD = 5.69); t(12) = 2.77, p = .017, %95 CI [1.87, 15.76], d = 1.48.
In the next section, you will also quickly learn how to visualize the data in two different ways: boxplots and violin plots.
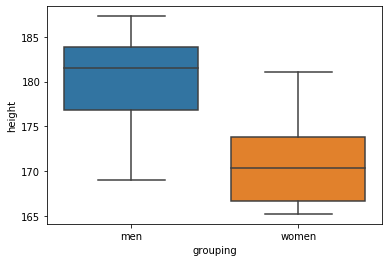
Visualize the Data using Boxplots:
One way to visualize data from two groups is using the box plot:
import seaborn as sns

sns.boxplot(x='grouping', y='height', data=df)
In the code chunk above, we imported seaborn (as sns), and used the boxplot method. First, we put the column that we want to display separate plots for on the x-axis. Here’s the resulting plot:
Visualize the Data using Violin Plots:
Here’s another way to report the results from the t-test: adding a violin plot to the report/manuscript:
import seaborn as sns

sns.violinplot(x='grouping', y='height', data=df)
As when creating the box plot, we import seaborn and add the columns/variables we want as x- and y-axis’. Here’s the resulting plot:

More on data visualization with Python:
- Seaborn Line Plots: A Detailed Guide with Examples (Multiple Lines)
- How to use Pandas Scatter Matrix (Pair Plot) to Visualize Trends in Data
- 9 Data Visualization Techniques You Should Learn in Python
- How to Make a Scatter Plot in Python using Seaborn
All the code examples in this post can be found in this Jupyter Notebook. Now, if you run this, make sure you have all the needed packages installed in your virtual environment.
Other Data Analysis Methods in Python
Finally, there are of course other ways to analyze your data. For instance, you can use Analysis of Variance (ANOVA) if there are more than two groups in the data. See the following posts about how to carry out ANOVA:
- Four Ways to Conduct One-Way ANOVA with Python
- Three ways to do a two-way ANOVA with Python
- Python MANOVA Made Easy using Statsmodels
Recently, there has been a growing interest in machine learning methods and you can see the following posts for more information:
Summary
In this post, you have learned 3 methods to perform a two-samples t-test.Specifically, in this post you have learned how to install, and use, three Python packages that can be used for data analysis. Furthermore, you have learned how to interpret and report the results from this statistical test. Below, you will find some useful resources and references if you want to learn more. As far as I am concerned, the Python package Pingouin will give you the most comprehensive result and that’s the package I’d choose.
Additional Resources and References
Here are some useful peer-reviewed articles, blog posts, and books. Refer to these if you want to learn more about the t-test, p-value, effect size, and Bayes Factors.
Cohen, J. (1988). Statistical Power Analysis for the Behavioral Sciences (2nd ed.). Hillsdale, NJ: Lawrence Erlbaum Associates, Publishers.
Independent Samples T-Test (Paywalled)
Interpreting P-values.
It’s the Effect Size, Stupid – What effect size is and why it is important
Using Effect Size—or Why the P Value Is Not Enough.
Beyond Cohen’s d: Alternative Effect Size Measures for Between-Subject Designs (Paywalled).
A tutorial on testing hypotheses using the Bayes factor.
The post How to Perform a Two-Sample T-test with Python: 3 Different Methods appeared first on Erik Marsja.
from Planet Python
via read more


No comments:
Post a Comment