The post Create a Correlation Matrix in Python with NumPy and Pandas appeared first on Erik Marsja.
In this post, we will go through how to calculate a correlation matrix in Python with NumPy and Pandas. Now, there will be a number of Python correlation matrix examples in this tutorial. First, we will read data from a CSV fil so we can, in a simple way, have a look at the numpy.corrcoef and Pandas DataFrame.corr methods.
Now, building a correlation table (matrix) comes in handy, especially, if we have a lot of variables in our data (see three more reasons by reading further). At the end of the post, there’s a link to a Jupyter Notebook with code examples.
Prequisites
Now, before we go on and use NumPy and Pandas to create a correlation matrix in Python, we need to make sure we have what these Python packages installed. If there’s a scientific Python distribution, such as Anaconda or ActivePython, installed on the computer we are using we most likely don’t have to install the Python packages. In other cases, NumPy and Pandas can be installed using conda (Anaconda/Miniconda) or pip.
Installing Python Packages with pip and conda
For more examples, on how to install Python packages, check that post out. That said, open up a Terminal Window or Anaconda prompt and type: pip install pandas numpy (pip) or To install this package with conda run: conda install -c anaconda numpy. Note, upgrading pip, if needed, can also be done with pip.
What is a Correlation Matrix?
A correlation matrix is used to examine the relationship between multiple variables at the same time. When we do this calculation we get a table containing the correlation coefficients between each variable and the others. Now, the coefficient show us both the strength of the relationship and its direction (positive or negative correlations). In Python, a correlation matrix can be created using the Python packages Pandas and NumPy, for instance.
How do You do a Correlation Matrix in Python?
Now, that we know what a correlation matrix is, we will look at the simplest way to do a correlation matrix with Python: with Pandas.
import pandas as pd
df = pd.read_csv('datafile.csv')

df.cor()
The above code, would give you a correlation matrix printed in e.g. a Jupyter Notebook. Read the post for more information.
<<
<<
Applications of a Correlation Matrix
Now, before we go on to the Python code, here are three general reasons for creating a correlation matrix:
- If we have a big data set, and we have an intention to explore patterns.
- For use in other statistical methods. For instance, correlation matrices can be used as data when conducting exploratory factor analysis, confirmatory factor analysis, structural equation models.
- Correlation matrices can also be used as a diagnostic when checking assumptions for e.g. regression analysis.
Correlation Method
Now, the majority of correlation matrices use Pearson’s Product-Moment Correlation (r). Depending on whether the data type of our variables, or whether the data follow the assumptions for correlation, there are other methods commonly used such as Spearman’s Correlation (rho) and Kendall’s Tau.

In the next section, we are going to get into the general syntax of the two methods to a compute correlation matrix in Python.
Syntax corrcoef and cor
Here we will find the general syntax for computation of correlation matrixes with Python using 1) NumPy, and 2) Pandas.
Correlation Matrix with NumPy
To create a correlation table in Python using NumPy, this is the general syntax:
np.corrcoef(x)Now, in this case, x is a 1-D or 2-D array with the variables and observations we want to get the correlation coefficients of. Furthermore, every row of x represents one of our variables whereas each column is a single observation of all our variables. Don’t worry, we look into how to use np.corrcoef later.
Correlation Matrix using Pandas
To create a correlation table in Python with Pandas, this is the general syntax:
df.corr()Here, df is the DataFrame that we have and cor() is the method to get the correlation coefficients. Of course, we will look into how to use Pandas and the corr method later in this post.
Computing a Correlation Matrix in Python with NumPy
Now, we are going to get into some details of NumPy’s corrcoef method. Note, that this will be a simple example and refer to the documentation, linked at the beginning of the post, for more a detailed explanation.
First, we will load the data using the numpy.loadtxt method. Second, we will use the corrcoeff method to create the correlation table.
import numpy as np
data = './SimData/correlationMatrixPython.csv'
x = np.loadtxt(data, skiprows=1, delimiter=',',
unpack=True)
np.corrcoef(x)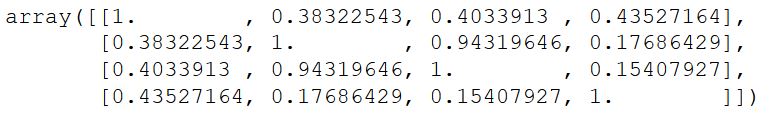 Correlation Matrix (NumPy Array)
Note, we used the skiprows argument to skip the first row containing the variable names, and the delimiter argument as the columns are delimited by comma. Finally, we used the unpack argument so that our data will follow the requirements of corrcoef. As a final note; using NumPy we cannot calculate Spearman’s Rho or Kendall’s Tau. That is, the corrcoef method will only return correlation Persons’ R coefficients.
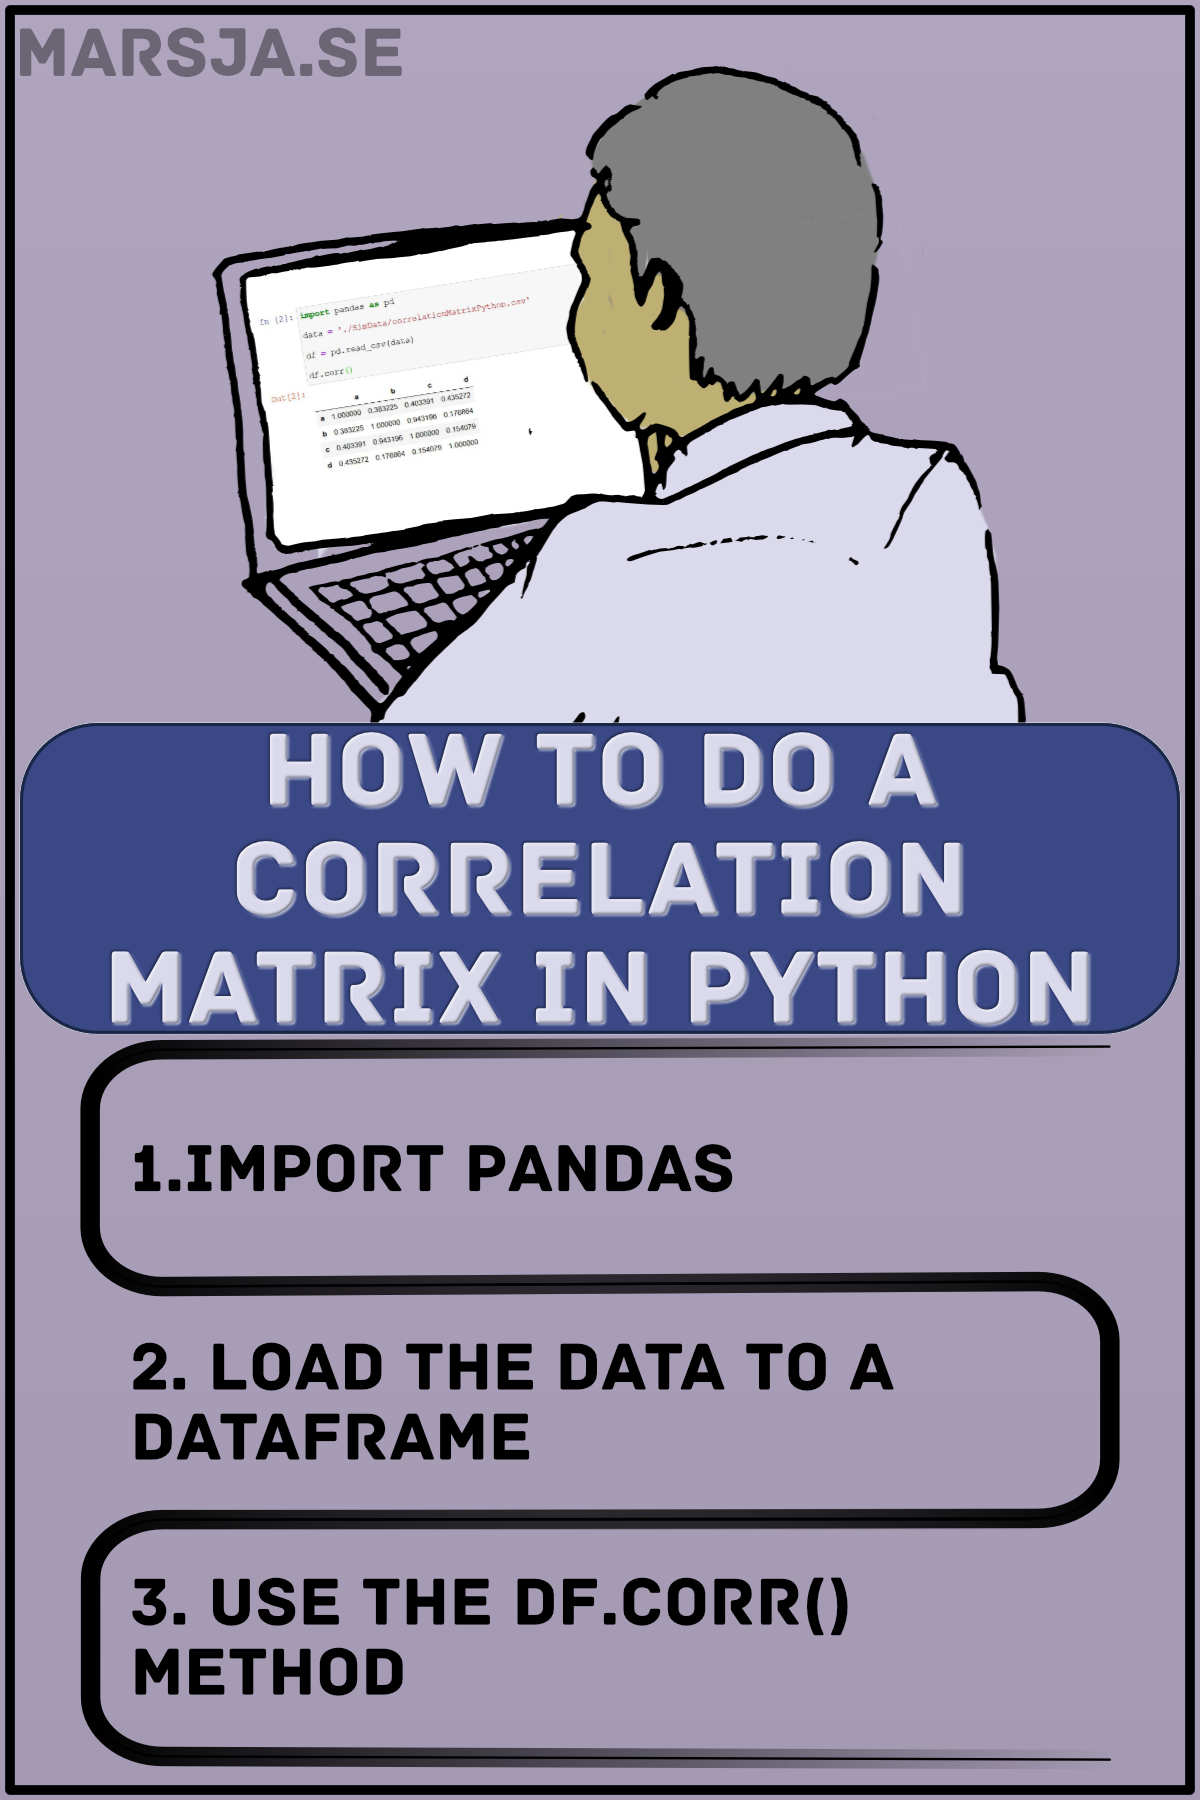
3 Steps to Creating a Correlation Matrix in Python with Pandas
In this section, we will learn how to do a correlation table in Python with Pandas in 3 simple steps.
1. Import Pandas
In the script, or Jupyter Notebook, we need to start by importing Pandas:
import pandas as pd2. Import Data in Python with Pandas
Import the data into a Pandas dataframe as follows:
data = './SimData/correlationMatrixPython.csv'

df = pd.read_csv(data)
df.head()
Now, remember that the data file needs to be in a subfolder, relative to the Jupyter Notebook, called ‘SimData’.
In the image below, we can see the values from the four variables in the dataset:
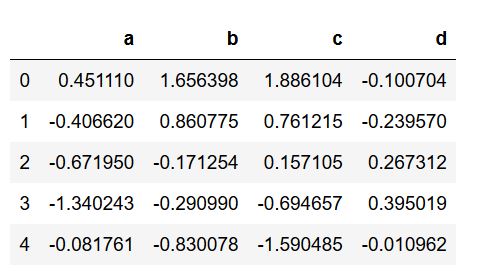 First 5 rows
It is, of course, important to give the full path to the data file. Note, there are of course other ways to create a Pandas dataframe. For instance, we can make a dataframe from a Python dictionary. Furthermore, it’s also possible to read data from an Excel file with Pandas, or scrape the data from a HTML table to a dataframe, to name a few.
3. Calculate the Correlation Matrix with Pandas:
Now, we are in the final step to create the correlation table in Python with Pandas:
df.corr()Using the example data, we get the following output when we print it in a Jupyter Notebook:
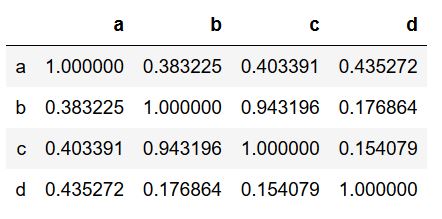 Correlation Table Created with Python Pandas
Finally, if we want to use other methods (e.g., Spearman’s Rho) we’d just add the method=’Spearman’ argument to the corr method. See the image below. Here’s a link to the example dataset.
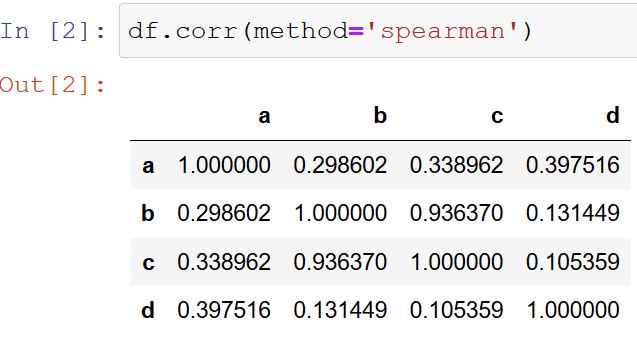 Correlation Matrix Containing Spearman’s Rhos
Upper and Lower Triangular Correlation Tables with Pandas
In this section, we are going to use NumPy and Pandas together with our correlation matrix (we have saved it as cormat:cormat = df.corr()).
import numpy as np
def triang(cormat, triang='lower'):
if triang == 'upper':
rstri = pd.DataFrame(np.triu(cormat.values),
index=cormat.index,
columns=cormat.columns).round(3)
rstri = rstri.iloc[:,1:]
rstri.drop(rstri.tail(1).index, inplace=True)
if triang == 'lower':
rstri = pd.DataFrame(np.tril(cormat.values),
index=cormat.index,
columns=cormat.columns).round(3)
rstri = rstri.iloc[:,:-1]
rstri.drop(rstri.head(1).index, inplace=True)
rstri.replace(to_replace=[0,1], value='', inplace=True)
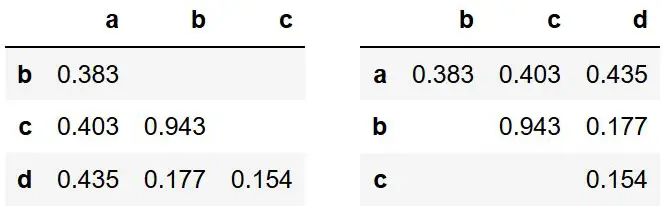
return(rstri)Now, this function can be run with the argument triang (‘upper’ or ‘lower’). For example, if we want to have the upper triangular we do as follows.
triang(cormat, 'upper')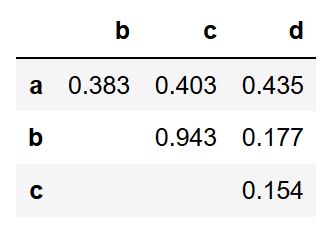 Pandas Correlation Table Upper Triangular
Now, there are of course other ways to communicate a correlation matrix. For example, we can explore the relationship between each variable (if they’re not too many) using Pandas scatter_matrix method to create a pair plot. Other options are to create a correlogram or a heatmap, for instance (see the post named 9 Data Visualization Techniques in Python you Need to Know, for more information about both these two methods).
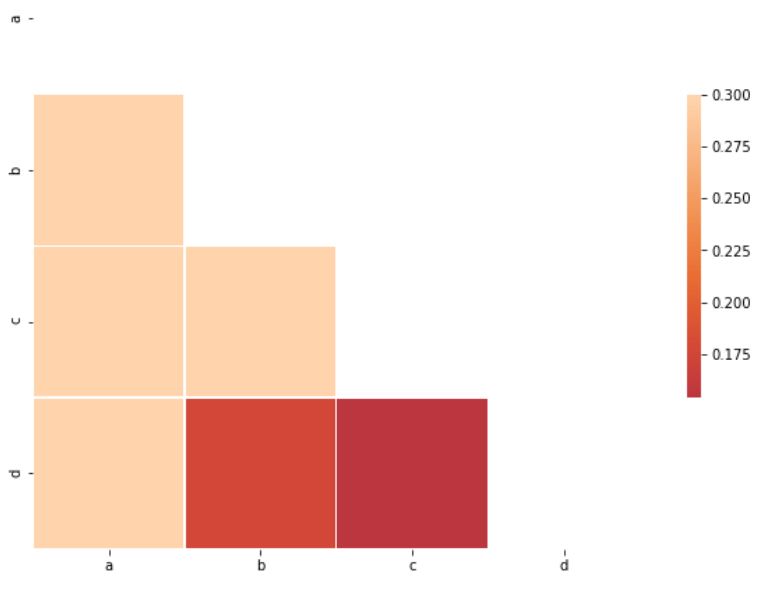 Correlation Matrix Visualized as a Heatmap
The above heatmap can be reproduced with the code found in the Jupyter Notebook here.
Conclusion
In this post, we have created a correlation matrix using Python and the packages NumPy and Pandas. In general, both methods are quite simple to use. If we need to use other correlation methods, we cannot use corrcoef, however. As we have seen, using Pandas corr method, this is possible (just use the method argument). Finally, we also created correlation tables with Pandas and NumPy (i.e., upper and lower triangular).

If there’s something that needs to be corrected, or something that should be added to this correlation matrix in Python tutorial, drop a comment below.
The post Create a Correlation Matrix in Python with NumPy and Pandas appeared first on Erik Marsja.
from Planet Python
via read more


No comments:
Post a Comment