In this post we will learn how to carry out repeated measures Analysis of Variance (ANOVA) in R and Python. To be specific, we will use the R package afex and the Python package pingouin to carry out one-way and two-way ANOVA f or within subject’s design. The structure of the following data analysis tutorial is as follows; a brief introduction to (repeated measures) ANOVA, carrying out within-subjects ANOVA in R using afex and in Python using pingouin. In the end, there will be a comparison of the results and the pros and cons using R or Python for data analysis (i.e., ANOVA).
What is ANOVA?
Before we go into how to carry out repeated measures ANOVA in R and Python, we are briefly going to learn what an ANOVA is. An ANOVA test is a parametrical method to find out whether the results from collected data are significant. That is, this type of test will enable us to figure out whether we should to reject the null hypothesis or accept the alternate hypothesis. In a between ANOVA we’re testing groups to see if there’s a statistical difference between them. In this post we are going to learn to do repeated measures ANOVA, however, and using this method we compare means across one or more variables that are based on repeated observations. These repeated observations can either be time points or different conditions. In the repeated ANOVA examples below we use different conditions.
For more information about ANOVA:
Data
In this repeated measures ANOVA example, we will use fake data (can be downloaded here). This fake data is a sample of 60 adults responding as fast as they can to visual stimuli. This, the dependent variable (DV) is response time to the visual stimuli. While the subjects were categorizing visual stimuli, they were either exposed to background noise or quiet (independent variable, iv1). 
In the first example, we are going to use these two conditions (iv1) when we carry out a one-way ANOVA for repeated measures. Furthermore, the visual stimuli could either be presented in the upper part, lower part, or in the middle part of the computer screen (independent variable, iv2).
The variables given in the data set:
- Sub_id = Subject ID #
- iv1 = Noise condition; quiet or noise
- iv2 = Location condition; upper, lower, middle
- DV = response time
Repeated Measures ANOVA in R
In this section we are going to learn how to do a repeated measures ANOVA in R using afex. More specifically, we are going to learn how carry out a one-way and two-way ANOVA using the aov_ez function. Note, working with aov_ez function we need to have our data in long format.
Installing afex
First, we are going to install the needed package: afex. In the code chunk, below , the package will only be installed if it’s not already installed.
list.of.packages <- c("afex", "emmeans")
new.packages <- list.of.packages[!(list.of.packages %in% installed.packages()[,"Package"])]
if(length(new.packages)) install.packages(new.packages)
One-Way Repeated Measures ANOVA in R.
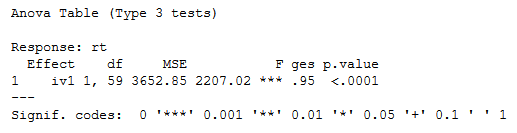
In the first example, we are going to carry out a one-way repeated measures ANOVA in R using aov_ez. Here we want to know whether there is any difference in response time with background noise compared to without background noise. To test this, we need to conduct a within-subjects ANOVA.
In the first code chunk, below, we load the package, the data, and print the first 5 rows using head
require(afex)

df <- read.csv(file='./Python_ANOVA/rmAOV2way.csv',
     header=TRUE, sep=',')

head(df)
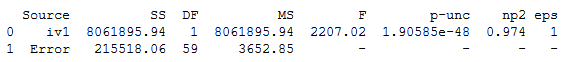
Example ANOVA for Within-Subjects Design:
aov <- aov_ez('Sub_id', 'rt',
              fun_aggregate = mean, df, within = 'iv1')
print(aov)
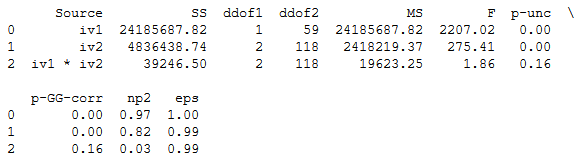
Two-Way Repeated Measures ANOVA in R
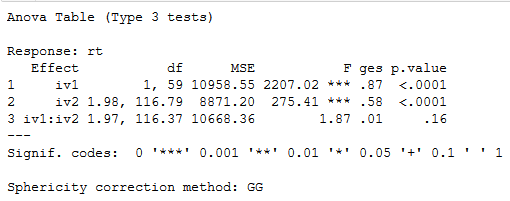
In the second example, we are going to conduct a two-way repeated measures ANOVA in R. Here we want to know whether there is any difference in response time during background noise compared to without background noise, and whether there is a difference depending on where the visual stimuli are presented (up, down, middle). Finally, we are interested if there is an interaction between the noise and location conditions.
aov <- aov_ez('Sub_id', 'rt', fun_aggregate = mean,
              df, within = c('iv1', 'iv2'))
print(aov)
 Plotting an Interaction
The R package afex also have a function to plot an interaction. Now, before continuing with the Python ANOVA, we are going to use this function.
afex_plot(aov, x = "iv1", trace = "iv2",
         error = "within")
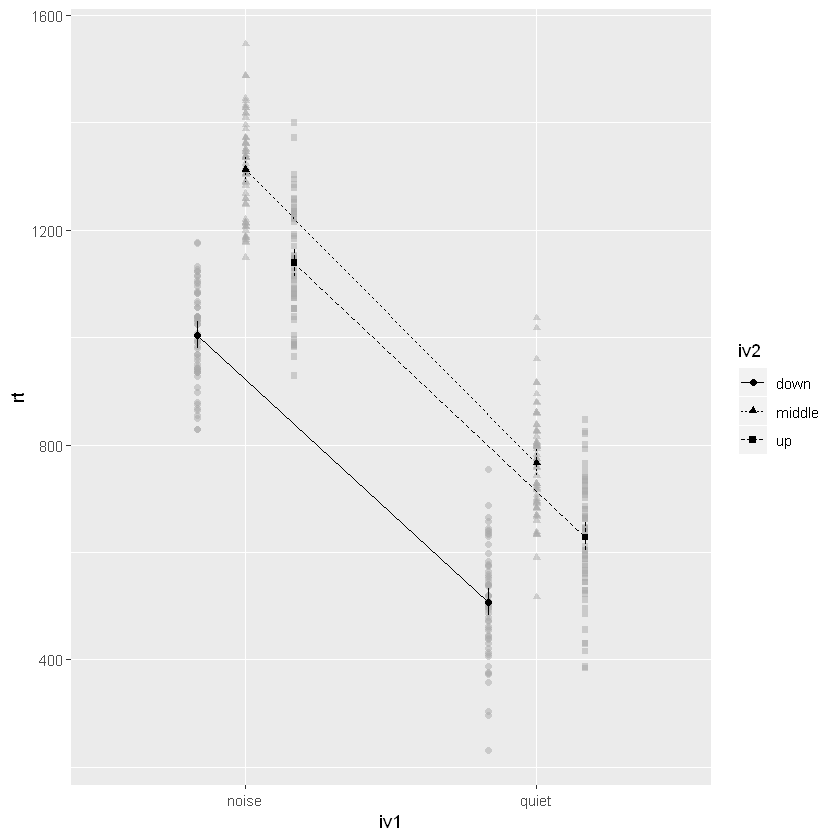 As can be seen, and confirmed by the ANOVA table above, we see that there is no interaction. If we had an interaction, we could follow this up with pairwise comparisons using the package emmeans.
Here’s a Jupyter Notebook containing the above code examples.
Repeated Measures ANOVA in Python
Now that we know how to conduct a within-subjects ANOVA in R we are going to carry out the same ANOVA in Python. In a previous post, we learned how to use the class AnovaRM from the Python package Statsmodels. In this post, however, we are going to use the package pingouin and the function anova_rm. Note, this function can handle both a wide and a long format data file.
One-Way Repeated Measures ANOVA in Python
In the first example, we are going to conduct a one-way ANOVA for repeated measures using Python. We start by imporring pandas as pd and pingoin as pg:
import pandas as pd
import pingouin as pg


df = pd.read_csv('./Python_ANOVA/rmAOV2way.csv')
df.head()
Learn more about how to work with Pandas dataframe and load data from different file types:
- A Basic Pandas Dataframe Tutorial for Beginners
- Pandas Read CSV Tutorial
- Pandas Excel Tutorial: How to Read and Write Excel files
Now we can carry out our repeated measures ANOVA using Python:
aov = pg.rm_anova(dv='rt', within='iv1',
                   subject='Sub_id', data=df, detailed=True)
print(aov.round(2))
 Two-Way Repeated Measures ANOVA in Python
In the second example, we are going to carry out a two-way ANOVA for repeated measures using Python.
 aov = pg.rm_anova(dv='rt',
                   within=['iv1', 'iv2'],
                   subject='Sub_id', data=df)
print(aov.round(2))
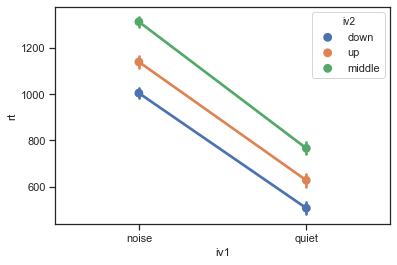
 Interaction Plot in Python using Seaborn
For completeness, even though we didn’t have a significant interaction, we are going to create an interaction plot using Seaborn:
import seaborn as sns

ax = sns.pointplot(x="iv1", y="rt", hue="iv2",
                    data=df)
Learn more about data visualization in Python:
- How to Make a Scatter Plot in Python using Seaborn
- 9 Data Visualization Techniques You Should Learn in Python
Pingouin also comes with a function to carry out pairwise comparison. If we had a significant interaction, we could use it. See this post for an example how to use this function.
Here’s a Jupyter Notebook containing the Python ANOVA examples above.
Conclusion: R vs Python
In this post, we have learned how to carry out one-way and two-way ANOVA for repeated measures using R and Python. We have used the r-package afex and the Python package pingouin. Both afex and pingouin are quite similar; they offer the Greenhouse-Geisser correction. In afex, however, you can c hoose to get either partial eta-squared or general eta-squared effect sizes. Furthermore, as can be seen in the ANOVA tables the results are basically the same.
In conclusion, the packages afex and pingouin offers an easy way to carry out ANOVA for within-subject designs in R and Python, respectively.
Resources
Here are some previous posts on how to carry out ANOVA in Python:
- Repeated Measures ANOVA in Python using Statsmodels
- Repeated measures ANOVA using Python
- Two-way ANOVA for repeated measures using Python
- Three ways to do a two-way ANOVA with Python
- Repeated Measures ANOVA using Statsmodels vs afex (YouTube)
The post Repeated Measures ANOVA in R and Python using afex & pingouin appeared first on Erik Marsja.
from Planet Python
via read more


No comments:
Post a Comment