The post Python MANOVA Made Easy using Statsmodels appeared first on Erik Marsja.
In previous posts, we learned how to use Python to detect group differences on a single dependent variable. However, there may be situations in which we are interested in several dependent variables. In these situations, the simple ANOVA model is inadequate.
One way to examine multiple dependent variables using Python would, of course, be to carry out multiple ANOVA. That is, one ANOVA for each of these dependent variables. However, the more tests we conduct on the same data, the more we inflate the family-wise error rate (the greater chance of making a Type I error).
This is where MANOVA comes in handy. MANOVA, or Multivariate Analysis of Variance, is an extension of Analysis of Variance (ANOVA). However, when using MANOVA we have two, or more, dependent variables.
MANOVA and ANOVA is similar when it comes to some of the assumptions. That is, the data have to be:
- normally distributed dependent variables
- equal covariance matrices)
In this post will learn how carry out MANOVA using Python (i.e., we will use Pandas and Statsmodels). Here, we are going to use the Iris dataset which can be downloaded here.
What is MANOVA?
First, we going to have brief introduction to what MANOVA is. MANOVA is the acronym for Multivariate Analysis of Variance. When analyzing data, we may encounter situations where we have there multiple response variables (dependent variables). As mentioend before, by using MANOVA we can test them simultaneously.
MANOVA Example
Before getting into how to do a MANOVA in Python, let’s look at an example where MANOVA can be a useful statistical method. Assume we have a hypothesis that a new therapy is better than another, more common, therapy (or therapies, for that matter). In this case, we may want to look at the effect of therapies (independent variable) on the mean values of several dependent variables.
For instance, we may be interested in whether the therapies helps for a specific psychological disorder (e.g., depression), at the same time as we want to know how it changes life satisfaction, lower suicide risk, among other things. In such an experiment a MANOVA lets us to test our hypothesis for all three dependent variables at once.
Assumptions of MANOVA
In this section, we will briefly discuss some of the assumptions of carrying out MANOVA. There are certain conditions that need to be considered.
- The dependent variables should be normally distributed within groups. That is, in the example below the dependent variables should be normally ditributed within the different treatment groups.
- Homogeneity of variances across the range of predictors.
- Linearity between all pairs of dependent variables (e.g., between depression, life satisfaction, and suicide risk), all pairs of covariates, and all dependent variable-covariate pairs in each cell
How to Carry out MANOVA in Python
In this section we will focus on how to conduct the Python MANOVA using Statsmodels. First, the first code example, below, we are going to import Pandas as pd. Second, we import the MANOVA class from statsmodels.multivariate.manova.
import pandas as pd
from statsmodels.multivariate.manova import MANOVA
Before carrying out the Python MANOVA we need some example data. This is why we use Pandas. In the next code chunk, we are going to read a CSV file from an URL using Pandas read_csv. We are also going to replace the dots (“.”) in the column names with underscores (“_”). If you need to find out more about cleaning your data see post data cleaning in Python with Pandas.
url = 'https://vincentarelbundock.github.io/Rdatasets/csv/datasets/iris.csv'
df = pd.read_csv(url, index_col=0)
df.columns = df.columns.str.replace(".", "_")
df.head()
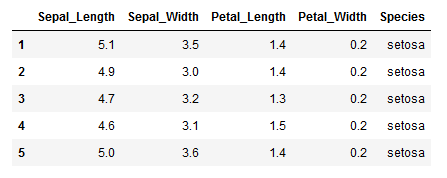 Dataframe
Learn more about working with Pandas dataframe:
- Pandas Read Excel Tutorial
- Read CSV files using Pandas
- How to Group Data using Pandas Groupby
- Pandas Dataframe Tutorial
Python MANOVA Example
Now that we have read a data file (i.e., a CSV file) using Pandas we are ready to carry out the MANOVA in Python. In the Python MANOVA example below we are going to use the from_formula method. This method takes the formula as a string object.
In this MANOVA example we are going to use the width and length columns as dependent variables. Furthermore, the species column is used as independent variable. That is, we are carrying out a one-way MANOVA here:
maov = MANOVA.from_formula('Sepal_Length + Sepal_Width + \
                            Petal_Length + Petal_Width  ~ Species', data=df)
Finally, we have used Python to do a one-way MANOVA. The last thing to do is to print the MANOVA table using the mv_test method:
print(maov.mv_test())
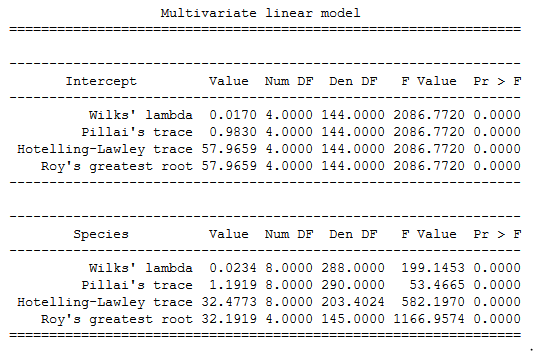 Python MANOVA table
Here’s a link to a Jupyter Notebook containing the MANOVA Statsmodels example in this post.
Conclusion
In this post, we learned how to carry out a Multivariate Analysis of Variance (MANOVA) using Python and Statsmodels. More specifically we have:
- used Pandas do load a dataset from a CSV file.
- cleaned column names of a Pandas dataframe
- learned multivariate analysis by a MANOVA statsmodels example
Resources
Analysis of Variance using Python:
Repeated Measures Analysis of Variance using Python:
The post Python MANOVA Made Easy using Statsmodels appeared first on Erik Marsja.
from Planet Python
via read more


No comments:
Post a Comment