Wednesday, July 28, 2021

Python and REST APIs: Interacting With Web Services

There’s an amazing amount of data available on the Web. Many web services, like YouTube and GitHub, make their data accessible to third-party applications through an application programming interface (API). One of the most popular ways to build APIs is the REST architecture style. Python provides some great tools not only to get data from REST APIs but also to build your own Python REST APIs.

In this tutorial, you’ll learn:

  • What REST architecture is
  • How REST APIs provide access to web data
  • How to consume data from REST APIs using the requests library
  • What steps to take to build a REST API
  • What some popular Python tools are for building REST APIs

By using Python and REST APIs, you can retrieve, parse, update, and manipulate the data provided by any web service you’re interested in.

REST Architecture

REST stands for representational state transfer and is a software architecture style that defines a pattern for client and server communications over a network. REST provides a set of constraints for software architecture to promote performance, scalability, simplicity, and reliability in the system.

REST defines the following architectural constraints:

  • Stateless: The server won’t maintain any state between requests from the client.
  • Client-server: The client and server must be decoupled from each other, allowing each to develop independently.
  • Cacheable: The data retrieved from the server should be cacheable either by the client or by the server.
  • Uniform interface: The server will provide a uniform interface for accessing resources without defining their representation.
  • Layered system: The client may access the resources on the server indirectly through other layers such as a proxy or load balancer.
  • Code on demand (optional): The server may transfer code to the client that it can run, such as JavaScript for a single-page application.

Note, REST is not a specification but a set of guidelines on how to architect a network-connected software system.

REST APIs and Web Services

A REST web service is any web service that adheres to REST architecture constraints. These web services expose their data to the outside world through an API. REST APIs provide access to web service data through public web URLs.

For example, here’s one of the URLs for GitHub’s REST API:

https://api.github.com/users/<username>

This URL allows you to access information about a specific GitHub user. You access data from a REST API by sending an HTTP request to a specific URL and processing the response.

HTTP Methods

REST APIs listen for HTTP methods like GET, POST, and DELETE to know which operations to perform on the web service’s resources. A resource is any data available in the web service that can be accessed and manipulated with HTTP requests to the REST API. The HTTP method tells the API which action to perform on the resource.

While there are many HTTP methods, the five methods listed below are the most commonly used with REST APIs:

HTTP method Description
GET Retrieve an existing resource.
POST Create a new resource.
PUT Update an existing resource.
PATCH Partially update an existing resource.
DELETE Delete a resource.

A REST API client application can use these five HTTP methods to manage the state of resources in the web service.

Status Codes

Once a REST API receives and processes an HTTP request, it will return an HTTP response. Included in this response is an HTTP status code. This code provides information about the results of the request. An application sending requests to the API can check the status code and perform actions based on the result. These actions could include handling errors or displaying a success message to a user.

Below is a list of the most common status codes returned by REST APIs:

Code Meaning Description
200 OK The requested action was successful.
201 Created A new resource was created.
202 Accepted The request was received, but no modification has been made yet.
204 No Content The request was successful, but the response has no content.
400 Bad Request The request was malformed.
401 Unauthorized The client is not authorized to perform the requested action.
404 Not Found The requested resource was not found.
415 Unsupported Media Type The request data format is not supported by the server.
422 Unprocessable Entity The request data was properly formatted but contained invalid or missing data.
500 Internal Server Error The server threw an error when processing the request.

These ten status codes represent only a small subset of the available HTTP status codes. Status codes are numbered based on the category of the result:

Read the full article at https://realpython.com/api-integration-in-python/ »


[ Improve Your Python With 🐍 Python Tricks 💌 – Get a short & sweet Python Trick delivered to your inbox every couple of days. >> Click here to learn more and see examples ]


from Real Python
read more

Stack Abuse: Observer Design Pattern in Python

Introduction

Software Design Patterns help accelerate the development process by providing a reusable blueprint for your code to solve a particular problem. We follow Design Patterns to write generalized, reusable, and readable code that could be easily understood by others familiar with the patterns we've applied.

They encapsulate cumulative experience of software engineers solving the same problems, and represent solutions to common design-related issuees.

There are different classifications of design patterns depending on which class of problems they solve - among which the Observer Design Pattern belongs to the Behavioral Pattern class.

This class of patterns determines how objects communicate with each other. In this guide, you will learn everything you need to know about the Observer Design Pattern and understand how we can use it to solve certain problems efficiently.

Observer Design Pattern

The Observer Design Pattern deals with One-to-Many relationships and utilizes events to let subscribed entities know about changes in an observable.

The source of these events is called the subject or observable which sends events as streams. The observers or sinks can subscribe to the observable to obtain the events. The observable keeps track of the list of observers and notifies them of the changes when the state of the observable changes.

Architecture Diagram of Observer Design Pattern - shows a news feed as an observable and multiple readers as observers subscribed to the news feed

This functionality has many implications and implementations, and similar functionality is all around you. It's an extremely simple, yet very effective and wide-spread pattern.

A similar implementation of this design pattern is seen in generating feeds on your social platforms - the Pub/Sub (Publisher/Subscriber) Model/Pattern. When a content publisher publishes their posts, the subscribers get notified of the content. A similar analogy may be people looking out for a flare signal or a firework for a certain event, and reacting (or not) depending on their specific roles.

Does that mean that the Observer Design Pattern and Publish/Subscribe Pattern are the same?

Previously, both patterns were synonymous. Nowadays, each pattern has distinct traits that make them two separate patterns.

The following are the major differences between the Observer Pattern and the Pub/Sub Pattern:

  • Observers and Subjects are tightly coupled. The subjects must keep track of their observers. Whereas in the Pub/Sub pattern, they are loosely coupled with a message queue in between observers and subjects.
  • The events are passed in a synchronous manner from the Subjects to the Observers. But in Pub/Sub patterns, the events are passed asynchronously.
  • In the Observer pattern, both the Subjects and Observers reside on the same application locality whereas they can reside on different localities in the Pub/Sub pattern.

One of the best ways to get a feel for this pattern is to implement it, let's implement it in Python!

Implementation

A basic implementation requires two classes - an Observable and an Observer. The Observer class is initialized with an object as an argument. The object is none other than an Observable to keep track of, to which it is subscribed upon creation.

The class also has a notify() function which triggers a reaction and acknowledges the receival of a notification/event from the observable:

class Observer:

    def __init__(self, observable):
        observable.subscribe(self)

    def notify(
        self,
        observable,
        *args,
        **kwargs
        ):
        print ('Got', args, kwargs, 'From', observable)

The Observable class is initialized with an empty list to hold the Observer instances. It also has functions such as subscribe() to add an observer, notify_observers() to call the notify() function on each observer, and unsubscribe() to remove the observer from the list:

class Observable:

    def __init__(self):
        self._observers = []

    def subscribe(self, observer):
        self._observers.append(observer)

    def notify_observers(self, *args, **kwargs):
        for obs in self._observers:
            obs.notify(self, *args, **kwargs)

    def unsubscribe(self, observer):
        self._observers.remove(observer)

Plugging in all of the above-mentioned components, let's write some code that sets up an observer and observable and sends messages, which triggers a reaction:

# observer_pattern.py

"""
Demonstrating the Observer pattern implementation
"""
# Initializing the subject
subject = Observable()

# Initializing twp observers with the subject object
observer1 = Observer(subject)
observer2 = Observer(subject)

# The following message will be notified to 2 observers
subject.notify_observers('This is the 1st broadcast',
                         kw='From the Observer')
subject.unsubscribe(observer2)

# The following message will be notified to just 1 observer since
# the observer has been unsubscribed
subject.notify_observers('This is the 2nd broadcast',
                         kw='From the Observer')

Notice that we also unsubscribe an observer before publishing the second message. This will lead to the message being printed only once instead of twice on the second attempt, as it is received by only one subscriber.

Running this code will result in:

$ python observer_pattern.py
Got ('This is the 1st broadcast',) {'kw': 'From the Observer'} From <__main__.Observable object at 0x7f6c50d2fb50>
Got ('This is the 2nd broadcast',) {'kw': 'From the Observer'} From <__main__.Observable object at 0x7f6c50d2fb50>

As you can see, the observable can directly interact with the observers and vice versa. The observable will be in interaction with the observer as long as the observer is subscribed to the observable's subscription list.

Pros & Cons

With the implementation in place, the pros and cons of this design pattern can be compared as follows:

Pros:

  • The one-to-many relationship is defined between the objects. This ensures that when an object is altered, it will lead to a cascade of changes to be applied to the dependent objects.

  • Loosely coupled objects mean that the components can be interchanged.

Cons:

  • The communication between the observable and observer is synchronous and with an increased load of subscribing and unsubscribing events, the observable object could be bombarded with requests. This could be mitigated by setting up a sleep time for each request.

  • The sleep solution could also cause a possible loss of speed, performance, and events. This was the main reason for the Pub/Sub pattern to have a message queue in between the publisher and subscriber.

  • Memory leaks are common in this pattern since there is a strong reference between the observer and observable. The observables need to be mandatorily deregistered from the observable object.

To mitigate most of the cons, a message queue was introduced in between the observer and the observable to overcome all these problems, which led to devising the Pub/Sub pattern - a variation of the Observer Pattern.

Conclusion

This guide covered the the Observer Pattern, how it can be implemented, and compares its pros and cons.

It's interesting to note that the Observer Pattern is one of the Behavioral Patterns that has led to many of the features we use today, such as RSS feeds, social media feeds, etc.

By being introduced to the nuances of the Design Patterns, it is easier to build the functionality from the ground up. And of course, knowing different Design Patterns allows you to build the best solution for different types of problems.


from Planet Python
via read more

How To Calculate Stocks Support And Resistance Using Clustering

How To Calculate Stocks Support And Resistance Using Clustering

In this notebook, I will show you how to calculate Stocks Support and Resistance using different clustering techniques.

Stock Data - I have stocks data in mongo DB. You can also get this data from Yahoo Finance for free.

MongoDB Python Setup
In [1]:
import pymongo
from pymongo import MongoClient
client_remote = MongoClient('mongodb://localhost:27017')
db_remote = client_remote['stocktdb']
collection_remote = db_remote.stock_data
Get Stock Data From MongoDB

I will do this analysis using last 60 days of Google data.

In [2]:
mobj = collection_remote.find({'ticker':'GOOGL'}).sort([('_id',pymongo.DESCENDING)]).limit(60)
Prepare the Data for Data Analysis

I will be using Pandas and Numpy for the data manipulation. Let us first get the data from Mongo Cursor object to Python list.

In [3]:
prices = []
for doc in mobj:
    prices.append(doc['high'])
Stocks Support and Resistance Using K-Means Clustering
In [4]:
import numpy as np
import pandas as pd
import matplotlib.pyplot as plt
from sklearn.cluster import AgglomerativeClustering

For K means clustering, we need to get the data in

(continued...)

from Planet SciPy
read more

How to Kick Off a Machine Learning Project With Less Data

If machine learning solutions were cars, their fuel would be data. Simply viewed, ML models are statistical equations that need values and variables to operate, and the data is the biggest contributor to ML success. Today, sources of data are ample, and the amount of available data keeps growing exponentially. This allows us to wrangle, […]

The post How to Kick Off a Machine Learning Project With Less Data appeared first on neptune.ai.


from Planet SciPy
read more

Tuesday, July 27, 2021

John Ludhi/nbshare.io: How To Calculate Stocks Support And Resistance Using Clustering

How To Calculate Stocks Support And Resistance Using Clustering

In this notebook, I will show you how to calculate Stocks Support and Resistance using different clustering techniques.

Stock Data - I have stocks data in mongo DB. You can also get this data from Yahoo Finance for free.

MongoDB Python Setup

In [1]:
import pymongo
from pymongo import MongoClient
client_remote = MongoClient('mongodb://localhost:27017')
db_remote = client_remote['stocktwits']
collection_remote = db_remote.eod_stock_data

Get Stock Data From MongoDB

I will do this analysis using last 60 days of Google data.

In [2]:
mobj = collection_remote.find({'ticker':'GOOGL'}).sort([('_id',pymongo.DESCENDING)]).limit(60)

Prepare the Data for Data Analysis

I will be using Pandas and Numpy for the data manipulation. Let us first get the data from Mongo Cursor object to Python list.

In [3]:
prices = []
for doc in mobj:
    prices.append(doc['high'])

Stocks Support and Resistance Using K-Means Clustering

In [4]:
import numpy as np
import pandas as pd
import matplotlib.pyplot as plt
from sklearn.cluster import AgglomerativeClustering

For K means clustering, we need to get the data in to Numpy array format.

In [5]:
X = np.array(prices)

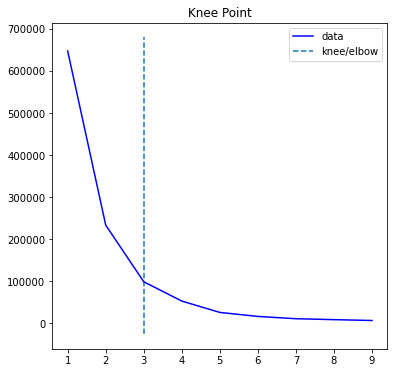
For K means clustering, K which means number of clusters is very important. We can find the optimal K using the Knee plot as shown below.

In [6]:
from sklearn.cluster import KMeans
import numpy as np
from kneed import KneeLocator
    
sum_of_sq_distances = []
K = range(1,10)
for k in K:
    km = KMeans(n_clusters=k)
    km = km.fit(X.reshape(-1,1))
    sum_of_sq_distances.append(km.inertia_)
kn = KneeLocator(K, sum_of_sq_distances,S=1.0, curve="convex", direction="decreasing")
kn.plot_knee()

Let us check the value of K using kn.knee

In [7]:
kn.knee
Out[7]:
3
In [8]:
kmeans = KMeans(n_clusters= kn.knee).fit(X.reshape(-1,1))
c = kmeans.predict(X.reshape(-1,1))
min_and_max = []
for i in range(kn.knee):
    min_and_max.append([-np.inf,np.inf])
for i in range(len(X)):
    cluster = c[i]
    if X[i] > min_and_max[cluster][0]:
        min_and_max[cluster][0] = X[i]
    if X[i] < min_and_max[cluster][1]:
        min_and_max[cluster][1] = X[i]

Let us check the min and max values of our clusters.

In [9]:
min_and_max
Out[9]:
[[2461.9099, 2365.55], [2687.98, 2508.0801], [2357.02, 2239.4399]]

There are 3 clusters shown above, every cluster has max and min value.

At the writing of this notebook, Google stock price is 2687.98 (high of day) which happens to be the 52 high as well. Therefore based on the above clusters, we can say that 2687.98 is the resistance and next support level is 2508.0801. The next levels of support are 2461.9099, 2365.55 2357.02, 2239.4399.

Remember these support and resistances will change depending upon the range of data and value of Clustering parameter K.

Stocks Support and Resistance Using Agglomerative Clustering

In [10]:
mobj = collection_remote.find({'ticker':'GOOGL'}).sort([('_id',pymongo.DESCENDING)]).limit(60)
prices = []
for doc in mobj:
    prices.append(doc['high'])

Another approach that can be used is Agglomerative Clustering which is hierarchical clustering.

Agglomerative clustering is a bottoms up approach which merges child clusters to find out the big clusters of data.

I have found Aggloerative to be useful on stocks rolling data.

Let us create a rolling data of 20 days each for both calculating max and min values.

In [11]:
df = pd.DataFrame(prices)
max = df.rolling(20).max()
max.rename(columns={0: "price"},inplace=True)
min = df.rolling(20).min()
min.rename(columns={0: "price"},inplace=True)

Below step is required to prepare the data in two column format.

In [12]:
maxdf = pd.concat([max,pd.Series(np.zeros(len(max))+1)],axis = 1)
mindf = pd.concat([min,pd.Series(np.zeros(len(min))+-1)],axis = 1)    
maxdf.drop_duplicates('price',inplace = True)
mindf.drop_duplicates('price',inplace = True)

Let us use n_clusters =3 value for our number of clusters.

In [13]:
F = maxdf.append(mindf).sort_index()
F = F[ F[0] != F[0].shift() ].dropna()

# Create [x,y] array where y is always 1
X = np.concatenate((F.price.values.reshape(-1,1),
                    (np.zeros(len(F))+1).reshape(-1,1)), axis = 1 )

cluster = AgglomerativeClustering(n_clusters=3,
          affinity='euclidean', linkage='ward')
cluster.fit_predict(X)
F['clusters'] = cluster.labels_

F2 = F.loc[F.groupby('clusters')['price'].idxmax()]

# Plotit
fig, axis = plt.subplots()
for row in F2.itertuples():

    axis.axhline( y = row.price, 
            color = 'green', ls = 'dashed' )

axis.plot( F.index.values, F.price.values )
plt.show()

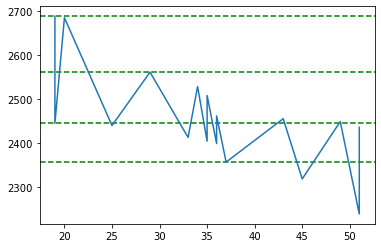
Let us plot our clusters now. As shown below, there are 2 clusters found. If we take in to account the todays closing price of Google which is 2638.00, we can say that 2687.98 is the resistance and 2357.02 is the support.

In [14]:
F2
Out[14]:
price 0 clusters
29 2561.1499 1.0 0
19 2687.9800 1.0 1
19 2445.1399 -1.0 0
37 2357.0200 -1.0 2

One thing to notice here is that, there are only 2 clusters at price 2357.02 which is not that many. To see if we can find more number of clusters either we have to increase our number of price points in our source data or increase the number of clusters, or make our rolling window smaller.

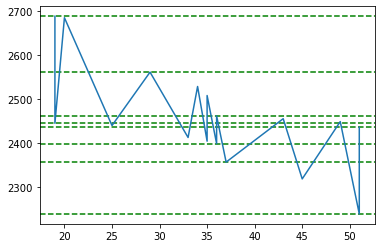
Let us increase the number of clusters to 5 and see what happens.

In [15]:
F = maxdf.append(mindf).sort_index()
F = F[ F[0] != F[0].shift() ].dropna()

# Create [x,y] array where y is always 1
X = np.concatenate((F.price.values.reshape(-1,1),
                    (np.zeros(len(F))+1).reshape(-1,1)), axis = 1 )

cluster = AgglomerativeClustering(n_clusters=5,
          affinity='euclidean', linkage='ward')
cluster.fit_predict(X)
F['clusters'] = cluster.labels_

F2 = F.loc[F.groupby('clusters')['price'].idxmax()]

# Plotit
fig, axis = plt.subplots()
for row in F2.itertuples():

    axis.axhline( y = row.price, 
            color = 'green', ls = 'dashed' )

axis.plot( F.index.values, F.price.values )
plt.show()
In [16]:
F2
Out[16]:
price 0 clusters
36 2399.0300 -1.0 0
36 2461.9099 1.0 0
29 2561.1499 1.0 1
37 2357.0200 -1.0 2
19 2687.9800 1.0 3
19 2445.1399 -1.0 0
51 2239.4399 -1.0 4
51 2436.0000 1.0 0

Ok this time around we got more number of clusters at price 2239.43 which is quite far from todays closing price of 2638. However the resistance number looks good of 2687.98 based on 3 clusters.

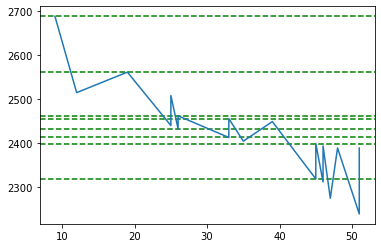
Let us make our rolling window smaller. Instead of 20 days let us make it 10 days.

In [17]:
df = pd.DataFrame(prices)
max = df.rolling(10).max()
max.rename(columns={0: "price"},inplace=True)
min = df.rolling(10).min()
min.rename(columns={0: "price"},inplace=True)
maxdf = pd.concat([max,pd.Series(np.zeros(len(max))+1)],axis = 1)
mindf = pd.concat([min,pd.Series(np.zeros(len(min))+-1)],axis = 1)    
maxdf.drop_duplicates('price',inplace = True)
mindf.drop_duplicates('price',inplace = True)
F = maxdf.append(mindf).sort_index()
F = F[ F[0] != F[0].shift() ].dropna()

# Create [x,y] array where y is always 1
X = np.concatenate((F.price.values.reshape(-1,1),
                    (np.zeros(len(F))+1).reshape(-1,1)), axis = 1 )

cluster = AgglomerativeClustering(n_clusters=5,
          affinity='euclidean', linkage='ward')
cluster.fit_predict(X)
F['clusters'] = cluster.labels_

F2 = F.loc[F.groupby('clusters')['price'].idxmax()]

# Plotit
fig, axis = plt.subplots()
for row in F2.itertuples():

    axis.axhline( y = row.price, 
            color = 'green', ls = 'dashed' )

axis.plot( F.index.values, F.price.values )
plt.show()
In [18]:
F2
Out[18]:
price 0 clusters
45 2318.8899 -1.0 0
45 2399.0300 1.0 4
19 2561.1499 1.0 1
26 2432.0601 -1.0 2
26 2461.9099 1.0 2
9 2687.9800 1.0 3
33 2412.8799 -1.0 4
33 2455.5100 1.0 2

Ok this data looks much better. We got a Google resistance around 2687.98 and support around 2399.03 and 2412.8799 which is quite close to say that support is around 2400.


from Planet Python
via read more

Podcast.__init__: Taking Aim At The Legacy Of SQL With The Preql Relational Language

SQL has gone through many cycles of popularity and disfavor. Despite its longevity it is objectively challenging to work with in a collaborative and composable manner. In order to address these shortcomings and build a new interface for your database oriented workloads Erez Shinan created Preql. It is based on the same relational algebra that inspired SQL, but brings in more robust computer science principles to make it more manageable as you scale in complexity. In this episode he shares his motivation for creating the Preql project, how he has used Python to develop a new language for interacting with database engines, and the challenges of taking on the legacy of SQL as an individual.

Summary

SQL has gone through many cycles of popularity and disfavor. Despite its longevity it is objectively challenging to work with in a collaborative and composable manner. In order to address these shortcomings and build a new interface for your database oriented workloads Erez Shinan created Preql. It is based on the same relational algebra that inspired SQL, but brings in more robust computer science principles to make it more manageable as you scale in complexity. In this episode he shares his motivation for creating the Preql project, how he has used Python to develop a new language for interacting with database engines, and the challenges of taking on the legacy of SQL as an individual.

Announcements

  • Hello and welcome to Podcast.__init__, the podcast about Python’s role in data and science.
  • When you’re ready to launch your next app or want to try a project you hear about on the show, you’ll need somewhere to deploy it, so take a look at our friends over at Linode. With the launch of their managed Kubernetes platform it’s easy to get started with the next generation of deployment and scaling, powered by the battle tested Linode platform, including simple pricing, node balancers, 40Gbit networking, dedicated CPU and GPU instances, and worldwide data centers. Go to pythonpodcast.com/linode and get a $100 credit to try out a Kubernetes cluster of your own. And don’t forget to thank them for their continued support of this show!
  • Your host as usual is Tobias Macey and today I’m interviewing Erez Shinan about Preql, an interpreted, relational programming language, that specializes in database queries

Interview

  • Introductions
  • How did you get introduced to Python?
  • Can you describe what Preql is and the story behind it?
    • What are goals and target use cases for the project?
  • There have been numerous projects that aim to make SQL more maintainable and composable. What is it about the language and syntax that makes it so challenging?
    • How does Preql approach this problem that is different from other efforts? (e.g. ORMs, dbt-style Jinja, PyPika)
  • How did you approach the design of the syntax to make it familiar to people who know SQL?
  • Can you describe how Preql is implemented?
    • How has the design and architecture changed or evolved since you began working on it?
  • What is a typical workflow for someone using Preql to build a library of analytical queries?
  • Beyond strict compilation to SQL, what are some of the other features that you have incorporated into Preql?
    • How does a Preql program get executed against a target database, particularly when using capabilities that can’t be directly translated to SQL?
  • ** What are the main difficulties / challenges of compiling to SQL ?
  • What are some of the features or use cases that are not immediately obvious or prone to be overlooked that you think are worth mentioning?
  • What are the most interesting, innovative, or unexpected ways that you have seen Preql used?
  • What are the most interesting, unexpected, or challenging lessons that you have learned while working on Preql?
  • When is Preql the wrong choice?
  • What do you have planned for the future of Preql?

Keep In Touch

Picks

Closing Announcements

  • Thank you for listening! Don’t forget to check out our other show, the Data Engineering Podcast for the latest on modern data management.
  • Visit the site to subscribe to the show, sign up for the mailing list, and read the show notes.
  • If you’ve learned something or tried out a project from the show then tell us about it! Email hosts@podcastinit.com) with your story.
  • To help other people find the show please leave a review on iTunes and tell your friends and co-workers
  • Join the community in the new Zulip chat workspace at pythonpodcast.com/chat

Links

The intro and outro music is from Requiem for a Fish The Freak Fandango Orchestra / CC BY-SA


from Planet Python
via read more

PyBites: PyBites Website 2.0 is here

Hey, what just happened to the pybit.es site?!

After 4.5 years of content updates, products and growth, the site just got outdated, unmanageable and even confusing. The pain was real and we needed a fix!

The site was first created using Pelican, a (Python) static site generator + GitHub pages and we were happy with it. It’s great technology and it supported our growth as a blog, team and business.

However, it was hard to keep the design professional / responsive and made it difficult to work with multiple authors.

A simple refactoring could not do this time. It was time for a complete rewrite and redesign of the site.

So we hired a professional web developer and he did an amazing job!

Screenshot 2021 07 27 at 14.01.00How the PyBites website has evolved over the years.

A few features we want to highlight:

  • Front and center is the core of our business: helping people become confident developers through our coaching.
  • We think the reading experience of the articles is much better, especially with the addition of dark mode (see bottom right). Fun fact: we flippantly added dark mode one day on our coding platform and people were raving about it, so dark mode was high up on the list for the new site.
  • The design greatly simplifies navigation and how you can find all of our resources. The old design did not do justice to the great amount of resources and products we have to offer. As the Zen of Python says: Explicit is better than implicit and Simple is better than complex. (It’s funny how often this applies even outside the realm of coding Python!)

We hope you like the new design and as always we’re happy to receive any feedback to keep improving it.

We’d also love to hear what we can do more of to serve you well on your Python journey.

Thanks for being a part of PyBites.

PS. by the way, Pelican is still an amazing open source tool we recommend to get your site up and running fast (see our training here).


from Planet Python
via read more

TestDriven.io: Working with Static and Media Files in Django

This article looks at how to work with static and media files in a Django project, locally and in production. from Planet Python via read...