Sunday, June 30, 2019

Techiediaries - Django: Python 3 GUI: wxPython 4 Tutorial - Urllib & JSON Example

In this tutorial, we'll learn to build a Python 3 GUI app from scratch using wxPython and Urllib. We'll be consuming a third-party news REST API available from newsapi.org which provides breaking news headlines, and allows you to search for articles from over 30,000 news sources and blogs worldwide. We'll use Urllib for sending HTTP requests to the REST API and the json module to parse the response.

Throughout you'll understand how to create desktop user interfaces in Python 3, including adding widgets, and managing data. In more details, you'll see:

  • How to use Urllib to send HTTP requests to fetch JSON data from a third-party REST API.
  • How to use the json module to parse JSON data into Python 3 dictionaries.
  • How to use the webbrowser module to open URLs in your default web browser.

First of all, head over to the registration page and create a new account then take note of the provided API key which will be using later to access the news data.

What is wxPython

wxPython is a Python wrapper around wxWidgets - the cross platform C++ library for building desktop apps for macOS, Linux and Windows. wxPython was created by Robin Dunn.

Prerequisites

You will need to have the following prerequisistes:

  • Python 3 and pip installed on your system,
  • A basic knowledge of Python.

Installing wxPython 4

Let's start by installing wxPython 4 using pip. Open a new terminal and simply run the following command:

$ pip install wxpython

If the installation fails, you may be requiring some dependencies depending on your operating system. Check out the prerequisites section in the official GitHub repository for more information.

Creating your First wxPython 4 GUI Window

After installing wxPython, you can easily create your first GUI window by creating a Python single file and call the wx.App() and the wx.Frame() methods.

Inside your working folder, create a newsy.py file and add the following code:

import wx

app = wx.App()
frame = wx.Frame(parent=None, title='Newsy: Read the World News!')
frame.Show()
app.MainLoop()

In this example, we use two essentials classes - wx.App and wx.Frame.

The wx.App class is used to instantiate a wxPython application object .

From the wx.Appobject, you can call the MainLoop() method which starts the event loop which is used to listen for events in your application.

wx.Frame is used to create a window. In our example, we created a window with no parent has the Newsy: Read the World News! title.

Now, run your GUI app using the following command from your terminal:

$ python newsy.py

This is a screenshot of our GUI window:

wxPython 4 GUI Window

Let's refactor our code and create a menu and status bars. First, we create a MainWindow class that extends the wx.Frame class:

class MainWindow(wx.Frame):
    def __init__(self, parent, title):

        super(MainWindow, self).__init__(parent, title = title, size = (600,500))
        self.Centre()
        self.CreateStatusBar()
        self.createMenu()

    def createMenu(self):

        menu= wx.Menu()
        menuExit = menu.Append(wx.ID_EXIT, "E&xit", "Quit application")

        menuBar = wx.MenuBar()
        menuBar.Append(menu,"&File")
        self.SetMenuBar(menuBar)

        self.Bind(wx.EVT_MENU, self.OnExit, menuExit)

    def OnExit(self, event):
        self.Close(True) #Close the frame

In the __init__() method, we call the Centre() method of wx.Frame to center the window in the screen. Next, we call the CreateStatusBar() method to create a status bar. Finally, we define and call the createMenu() method which:

  • Creates a menu using the wx.Menu() method,
  • Appends a menu item to quit the application,
  • Creates a menu bar and add the a File menu to it,
  • Binds the EVT_MENU to the OnExit() method which simply calls the Close() method to close the window.

Next, refacor the code for creating the app as follows:

if __name__ == '__main__':
    app = wx.App()
    window= MainWindow(None, "Newsy - read worldwide news!")
    window.Show()
    app.MainLoop()

After running the app, this is a screenshot of our window at this point:

Adding a wxPython Panel

According to the docs:

A panel is a window on which controls are placed. It is usually placed within a frame. Its main feature over its parent class wx.Window is code for handling child windows and TAB traversal, which is implemented natively if possible (e.g. in wxGTK) or by wxWidgets itself otherwise.

Now, let's create a panel called NewsPanel that extends wxPanel:

class NewsPanel(wx.Panel):

    def __init__(self, parent):
        wx.Panel.__init__(self, parent)
        self.SetBackgroundColour("gray")

Next, let's instantiate the class in the MainWindow constructor for actually adding a panel to our window:

class MainWindow(wx.Frame):
    def __init__(self, parent, title):

        super(MainWindow, self).__init__(parent, title = title, size = (600,500))
        self.Centre()
        NewsPanel(self)
        self.createStatusBar()
        self.createMenu()         

Adding wxPython Lists for News and Sources

According to the docs:

A list control presents lists in a number of formats: list view, report view, icon view and small icon view. In any case, elements are numbered from zero. For all these modes, the items are stored in the control and must be added to it using wx.ListCtrl.InsertItem method.

After creating our panel, let's add two lists which will hold the sources and the news items:

class NewsPanel(wx.Panel):

    def __init__(self, parent):
        wx.Panel.__init__(self, parent)
        self.SetBackgroundColour("gray")

        self.sources_list = wx.ListCtrl(
            self, 
            style=wx.LC_REPORT | wx.BORDER_SUNKEN
        )
        self.sources_list.InsertColumn(0, "Source", width=200)

        self.news_list = wx.ListCtrl(
            self, 
            size = (-1 , - 1),
            style=wx.LC_REPORT | wx.BORDER_SUNKEN
        )
        self.news_list.InsertColumn(0, 'Link')
        self.news_list.InsertColumn(1, 'Title')

We use wx.ListCtrl to create a list in wxPython, next we call the InsertColumn() method for adding columns to our lists. For our first list, we only add one Source column. For the seconf lists we add two Link and Title columns.

Creating a Layout with Box Sizer

According to the docs:

Sizers ... have become the method of choice to define the layout of controls in dialogs in wxPython because of their ability to create visually appealing dialogs independent of the platform, taking into account the differences in size and style of the individual controls.

Next, let's place the two lists side by side using the BoxSizer layout. wxPython provides absoulte positioning and also adavanced layout algorithms such as:

  • wx.BoxSizer
  • wx.StaticBoxSizer
  • wx.GridSizer
  • wx.FlexGridSizer
  • wx.GridBagSizer

wx.BoxSizer allows you to place several widgets into a row or a column.

box = wx.BoxSizer(wx.VERTICAL | wx.HORIZONTAL)

The orientation can be wx.VERTICAL or wx.HORIZONTAL.

You can add widgets into the wx.BoxSizer using the Add() method:

box.Add(wx.Window window, integer proportion=0, integer flag = 0, integer border = 0)

In the __init__() method of our news panel, add the following code:

        sizer = wx.BoxSizer(wx.HORIZONTAL)
        sizer.Add(self.sources_list, 0, wx.ALL | wx.EXPAND)
        sizer.Add(self.news_list, 1, wx.ALL | wx.EXPAND)
        self.SetSizer(sizer)

This is a screenshot of our window with two lists:

Let's now start by populating the source list. First import the following modules:

import urllib.request 
import json

Next, define the API_KEY variable which will hold your API key that you received after creating an account with NewsAPI.org:

API_KEY = ''

Fetching JSON Data Using Urllib.request

Next, in NewsPanel, add a method for grabbing the news sources:

    def getNewsSources(self):
        with urllib.request.urlopen("https://newsapi.org/v2/sources?language=en&apiKey=" + API_KEY) as response:
            response_text = response.read()   
            encoding = response.info().get_content_charset('utf-8')
            JSON_object = json.loads(response_text.decode(encoding))            

            for el in JSON_object["sources"]:
                 print(el["description"] + ":")
                 print(el["id"] + ":")

                 print(el["url"] + "\n")
                 self.sources_list.InsertItem(0, el["name"])


Next, call the method in the constructor:

class NewsPanel(wx.Panel):

    def __init__(self, parent):
        wx.Panel.__init__(self, parent)
        # [...]
        self.getNewsSources()

That's it! If you run the application again, you should see a list of news sources displayed:

Now, when we select a news source from the list at left, we want the news from this source to get displayed on the list at the right. We first, need to define a method to fetch the news data. In NewsPanel, add the following method:

    def getNews(self, source):
         with urllib.request.urlopen("https://newsapi.org/v2/top-headlines?sources="+ source + "&apiKey=" + API_KEY) as response:
             response_text = response.read()   
             encoding = response.info().get_content_charset('utf-8')
             JSON_object = json.loads(response_text.decode(encoding))           
             for el in JSON_object["articles"]:
                 index = 0
                 self.news_list.InsertItem(index, el["url"])
                 self.news_list.SetItem(index, 1, el["title"])
                 index += 1


Next, we need to call this method when a source is selected. Here comes the role of wxPython events.

Binding wxPython Events

In the __init__() constructor of NewsPanel, call the Bind() method on the sources_list object to bind the wx.EVT_LIST_ITEM_SELECTED event of the list to the OnSourceSelected() method: ```py class NewsPanel(wx.Panel):

def __init__(self, parent):
    wx.Panel.__init__(self, parent)
    # [...]
    self.sources_list.Bind(wx.EVT_LIST_ITEM_SELECTED, self.OnSourceSelected)


Next, define the `OnSourceSelected()` method as follows:

```py
    def OnSourceSelected(self, event):
         source = event.GetText().replace(" ", "-")
         self.getNews(source)

Now, run your application and select a news source, you should get a list of news from the select source in the right list:

Open External URLs in Web Browsers

Now, we want to be able to open the news article, when selected, in the web browser to read the full article. First import the webbrowser module:

import webbrowser

Next, in NewsPanel define the OnLinkSelected() method as follows:

    def OnLinkSelected(self, event):
          webbrowser.open(event.GetText()) 

Finally, bind the method to the wx.EVT_LIST_ITEM_SELECTED on the news_list object:

class NewsPanel(wx.Panel):

    def __init__(self, parent):
        wx.Panel.__init__(self, parent)
        # [...]
        self.news_list.Bind(wx.EVT_LIST_ITEM_SELECTED , self.OnLinkSelected)

Now, when you select a news item, its corresponding URL will be opened in your default web browser so you can read the full article.

Resizing the Lists when the Window is Resized

If your resize your window, you'll notice that the lists are not resized accordingly. You can change this behavior by adding the following method to NewsPanel and bind it to the wx.EVT_PAINT event:

    def OnPaint(self, evt):
        width, height = self.news_list.GetSize()
        for i in range(2):
            self.news_list.SetColumnWidth(i, width/2)
        evt.Skip()

Next, bind the method as follows:

class NewsPanel(wx.Panel):

    def __init__(self, parent):
        wx.Panel.__init__(self, parent)
        # [...]        
        self.Bind(wx.EVT_PAINT, self.OnPaint) 

This is the full code:

Conclusion

In this tutorial, we've seen how to do desktop GUI development with Python 3 and wxPython. We've also seen:

  • How to use Urllib to send HTTP requests to fetch JSON data from a third-party REST API.
  • How to use the json module to parse JSON data into Python 3 dictionaries.
  • How to use the webbrowser module to open URLs in your default web browser.

We've also learned how to use wxPython to create windows, panels and lists and how to listen for events.


from Planet Python
via read more

Zato Blog: Integrating with Microsoft SQL Server via stored procedures

This article will show you how to invoke MS SQL stored procedures from Zato services - a feature new in the just released version 3.1 of the Python-based integration platform.

In web-admin

Start off by installing the latest updates.

Next, the first thing needed is creation of a new outgoing SQL connection - make sure to choose the MS SQL (Direct) type, as below.

It is considered a direct one because, even though it is based on SQLAlchemy, it does not make use of the most of SQLAlchemy's functionality and lets one invoke stored procedures alone, i.e. it is not possible to use this type of connections with ORM or anything else - only stored procedures are supported.

Make sure to change the password after creating a connection - the default one is a randomly generated string.

Python code

In most cases, to invoke a stored procedure, use the code below:

# -*- coding: utf-8 -*-


# Zato
from zato.server.service import Service

class MyService(Service):
    def handle(self):

        # Connection to use
        name = 'My MS SQL Connection'

        conn = self.outgoing.sql.get(name)
        session = conn.session()

        # Procedure to invoke
        proc_name = 'get_current_user'

        # Arguments it has on input
        args = ['my.user.id']

        data = session.callproc(proc_name, args)

        # Data is a list of dictionaries, each of which
        # represents a single row of data returned by the procedure.
        for row in data:
            ...

Lazy evaluation

The usage example above will work in many cases but, supposing a procedure returns many thousands of rows, it may not be efficient to read them in all in a single call.

This would potentially create a big list of row elements - if all them are indeed required in a single place then this is not a concern. But if they should be processed one by one then it may be better to explicitly fetch and process a single row at a time.

To achieve it, use_yield=True can be applied, as in the code below. Now, each iteration of the for loop will return a new row, without ever accumulating all of them in RAM.

# -*- coding: utf-8 -*-


# Zato
from zato.server.service import Service

class MyService(Service):
    def handle(self):

        # Connection to use
        name = 'My MS SQL Connection'

        conn = self.outgoing.sql.get(name)
        session = conn.session()

        # Procedure to invoke
        proc_name = 'get_current_user'

        # Arguments it has on input
        args = ['my.user.id']

        data = session.callproc(proc_name, args, use_yield=True)

        # Data is a Python generator now and each iteration
        # of the loop returns a new row from the stored procedure.
        for row in data:
            ...

Wrapping up

Ability to use MS SQL is a feature new in Zato 3.1 - it works in a way similar to other SQL connection types with the notable exception that only stored procedures can be invoked from Python code.

There are two ways to invoke stored procedures - either by reading the whole output into a service or processing rows one by one. The latter is recommended if a large number of rows is to be processed by the service.


from Planet Python
via read more

IslandT: Create a Python function to compare the end string

Hello friend, we will start a new Python project in the next chapter but before that let us solve another Python problem first in this article. This is one of the questions in codewars which I have solved today : Given a string and an end string, compare the end string part with the end part of the given string, if they match each other, then return true, otherwise return false. For example, if the given string is “Hello” and the end string is “ello” then the function will return true. If the given string is “World” and the end string is “rld!” the the function will return false.

The strategy of this function is to extract the last few words from the given string that match the length of the end string and then compare them one by one!

def solution(string, ending):

    endinglist = list(ending)
    stringlist = list(string)
    stringlist= stringlist[len(stringlist)-len(endinglist):] # the end part of the given string which matches the length of the end string
    
    while(len(endinglist) > 0):

        elem = endinglist.pop(0)
        elem_1 = stringlist.pop(0)
        if(elem != elem_1):
            return False
        
    return True

The program just goes through the while loop and if there is a wrong match then the loop will terminate and return False.

Well, what do you people think about the above code? Just like you, I am just starting to learn Python programming, if you have a better solution then do make sure everyone hear your voice by providing your better idea under the comment box below this post!

Beginning from the next chapter we will start a brand new Python project so make sure you subscribe to the rss feed under the Python category of this website, there is no harm to subscribe to other category as well because besides writing Python article I also write other topics as well! Go ahead and take a look at them!


from Planet Python
via read more

Saturday, June 29, 2019

Weekly Python StackOverflow Report: (clxxxiv) stackoverflow python report

These are the ten most rated questions at Stack Overflow last week.
Between brackets: [question score / answers count]
Build date: 2019-06-29 20:53:35 GMT

  1. Why was p[:] designed to work differently in these two situations? - [29/6]
  2. How do I create a new column in a dataframe from an existing column using conditions? - [11/5]
  3. Anaconda 4.7.5 - Warning about conda-build <3.18.3 and issues with python packages - [10/3]
  4. How to connect the ends of edges in order to close the holes between them? - [10/2]
  5. Why is NumPy sometimes slower than NumPy + plain Python loop? - [9/3]
  6. Find first and last non-zero column in each row of a pandas dataframe - [7/4]
  7. Why does * work differently in assignment statements versus function calls? - [7/1]
  8. How to vectorize a loop through a matrix numpy - [6/3]
  9. Pandas expanding/rolling window correlation calculation with p-value - [6/2]
  10. Using Pandas df.where on multiple columns produces unexpected NaN values - [6/1]


from Planet Python
via read more

Doug Hellmann: Dependencies between Python Standard Library modules

Glyph’s post about a “kernel python” from the 13th based on Amber’s presentation at PyCon made me start thinking about how minimal standard library could really be. Christian had previously started by nibbling around the edges, considering which modules are not frequently used, and could be removed. I started thinking about a more extreme change, …


from Planet Python
via read more

Dependencies between Python Standard Library modules

Glyph’s post about a “kernel python” from the 13th based on Amber’s presentation at PyCon made me start thinking about how minimal standard library could really be. Christian had previously started by nibbling around the edges, considering which modules are not frequently used, and could be removed. I started thinking about a more extreme change, …

from Doug Hellmann
via read more

ListenData: Python Data Structures

This post explains the data structures used in Python. It is essential to understand the data structures in a programming language. In python, there are many data structures available. They are as follows :
  1. strings
  2. lists
  3. tuples
  4. dictionaries
  5. sets
Python Data Structures
1. Strings
Python String is a sequence of characters.
How to create a string in Python
You can create Python string using a single or double quote.

mystring = "Hello Python3.6"
print(mystring)
Output:
Hello Python3.6
Can I use multiple single or double quotes to define string?
Answer is Yes. See examples below -
Multiple Single Quotes

mystring = '''Hello Python3.6'''
print(mystring)
Output:
Hello Python3.6
Multiple Double Quotes

mystring = """Hello Python3.6"""
print(mystring)
Output:
Hello Python3.6
How to include quotes within a string?

mystring = r'Hello"Python"'
print(mystring)
Output:
Hello"Python"
How to extract Nth letter or word?
You can use the syntax below to get first letter.

mystring = 'Hi How are you?'
mystring[0]
Output
'H'
mystring[0] refers to first letter as indexing in python starts from 0. Similarly, mystring[1] refers to second letter. To pull last letter, you can use -1 as index.

mystring[-1]
To get first word

mystring.split(' ')[0]
Output : Hi
How it works -

1. mystring.split(' ') tells Python to use space as a delimiter.

Output : ['Hi', 'How', 'are', 'you?']

2. mystring.split(' ')[0] tells Python to pick first word of a string.

2. List
Unlike String, List can contain different types of objects such as integer, float, string etc.
  1. x = [142, 124, 234, 345, 465]
  2. y = [‘A’, ‘C’, ‘E’, ‘M’]
  3. z = [‘AA’, 44, 5.1, ‘KK’]
Get List Item
We can extract list item using Indexes. Index starts from 0 and end with (number of elements-1). Syntax : list[start : stop : step]
  1. start : refers to starting position.
  2. stop : refers to end position.
  3. step : refers to increment value.

k = [124, 225, 305, 246, 259]
k[0]
k[1]
k[-1]
k[0]
124

k[1]
225

k[-1]
259

Explanation :

k[0] picks first element from list. Negative sign tells Python to search list item from right to left. k[-1] selects the last element from list.
To select multiple elements from a list, you can use the following method :
k[:3] returns [124, 225, 305]
k[0:3] also returns [124, 225, 305]
k[::-1] reverses the whole list and returns [259, 246, 305, 225, 124]
Sort list
sorted(list) function arranges list in ascending order. sorted(list, reverse=True) function sorts list in descending order.
sorted(k) returns [124, 225, 246, 259, 305]
sorted(k, reverse=True) returns [305, 259, 246, 225, 124]
Add 5 to each element of a list
In the program below, len() function is used to count the number of elements in a list. In this case, it returns 5. With the help of range() function, range(5) returns 0,1,2,3,4.

x = [1, 2, 3, 4, 5]
for i in range(len(x)):
x[i] = x[i] + 5
print(x)
[6, 7, 8, 9, 10]
It can also be written like this -

for i in range(len(x)):
x[i] += 5
print(x)
Combine / Join two lists
The '+' operator is concatenating two lists.

X = [1, 2, 3]
Y = [4, 5, 6]
Z = X + Y
print(Z)
[1, 2, 3, 4, 5, 6]
READ MORE »

from Planet Python
via read more

Ned Batchelder: Changelog podcast: me, double-dipping

I had a great conversation with Jerod Santo on the Changelog podcast: The Changelog 351: Maintainer spotlight! Ned Batchelder. We talked about Open edX, and coverage.py, and maintaining open source software.

One of Jerod’s questions was unexpected: what other open source maintainers do I appreciate? Two people that came to mind were Daniel Hahler and Julian Berman. Some people are well-known in the Python community because they are the face of large widely used projects. Daniel and Julian are known to me for a different reason: they seem to make small contributions to many projects. I see their names in the commits or issues of many repos I wander through, including my own.

This is a different kind of maintainership: not guiding large efforts, but providing little pushes in lots of places. If I had had the presence of mind, I would have also mentioned Anthony Sottile for the same reason.

And I would have mentioned Mariatta, for a different reason: her efforts are focused on CPython, but on the contribution process and tooling around it, rather than the core code itself. A point I made in the podcast was that people and process challenges are often the limiting factor to contribution, not technical challenges. Mariatta has been at the forefront of the efforts to open up CPython contribution, and I wish I had mentioned her in the podcast.


from Planet Python
via read more

EuroPython: EuroPython 2019: SIM cards for attendees

Switzerland is often not included in European cell provider’s roaming packages and also not covered by the EU roaming regulation, so you can potentially incur significant charges when going online with your mobile or notebook.

Please do check your mobile package to see whether it includes Switzerland in your roaming package.

Some providers offer special packages which can be bought as option to also cover Switzerland.

Swiss SIM cards available in ticket shop

In order to make things easier for you, we have purchased 300 SIM cards from a local Swiss cell provider, which we will make available in our ticket shop. After purchase, you can then pick up the cards at the registration desk (please bring your receipt).

image

These cards include 1 GB data with high-speed 4G/LTE and costs EUR 13.50, incl. 7.7% Swiss VAT.

Please check our SIM card page for more details.

Enjoy,

EuroPython 2019 Team
https://ep2019.europython.eu/
https://www.europython-society.org/


from Planet Python
via read more

EuroPython: EuroPython 2019: Social event tickets available

After the keynotes and talks on Thursday, July 11th, we’ve organized a social event at the workshop venue, the FHNW Muttenz. Starting at 19:00 CEST, you can join us for an evening party with finger food, drinks and music.

image

Tickets for the social event are not included in the conference ticket. They are now available in our ticket store (listed under ‘Other items’) for the price of 25 €. The social event ticket includes finger food and a choice of two drinks. 

image

Take this opportunity to network and socialize with other Python attendees and buy your social event ticket now on the registration page.

Enjoy,

EuroPython 2019 Team
https://ep2019.europython.eu/
https://www.europython-society.org/


from Planet Python
via read more

Moderna joins NumFOCUS Corporate Sponsors

The post Moderna joins NumFOCUS Corporate Sponsors appeared first on NumFOCUS.


from Planet SciPy
read more

IslandT: Return the highest volume of traffic during peak hour

In this article, we are going to create a function which will return a list of tuples that consist of a particular hour and the highest traffic volume for that particular hour. The stat has been taken every 10 minutes in each hour. For example, at 4.00pm the total numbers of traffics that pass through a junction for every 10 minutes are as follows: [23, 22, 45, 66, 54, 33]. The traffic volume measurement in this example will begin at 4.00pm and end at 8.00pm. Below is the solution to this problem.

def traffic_count(array):

    # first we will create the traffic volume list for 4pm, 5pm, 6pm and 7pm within a big list 
    count = 0
    arr_stat = []
    while(count < 24):
        arr_stat.append(array[count:count+6])
        count += 6

    # then we will create the tuple which consists of time and the peak traffic at that hour
    max = 0
    arrs = []
    time = 4
    
    for elem in arr_stat:
        for item in elem:
            if max < item : #find out the higest stat
                max = item
        arrs.append(((str(time) + ":00pm"), max))
        time += 1
        max = 0

    return arrs
traffic_count([23,24,34,45,43,23,57,34,65,12,19,45, 54,65,54,43,89,48,42,55,22,69,23,93]) # if you enter the above data into the function then you will get below outcome!
list of tuples consist of time vs traffic volume

Give your thought regarding this solution in the comment box below this post!


from Planet Python
via read more

Friday, June 28, 2019

Zero-with-Dot (Oleg Żero): Data science computation hara-kiri

Introdution

Beautiful algorithm, great results, all looks fine and seems to work, but… problem. It takes forever. We all have been through this. You may think: “it is only a proof-of-concept”. Or you may think, efficiency-wise, “python should not be used in the first place”. Well. Actually, it isn’t that bad if you know what methods you should use or rather which ones you shouldn’t.

Let’s begin with the underlying problem. When crafting of an algorithm, many of the tasks that involve computation can be reduced into one of the following categories:

  • selecting of a subset of data given a condition,
  • applying a data-transforming function onto each data/table entry,
  • vector-matrix multiplications (aka typical linear algebra).

There seems to be no data science in Python without numpy and pandas. (This is also one of the reason why Python has become so popular in Data Science). However, dumping the libraries on the data is rarely going to guarantee the peformance. So what’s wrong?

In this post, we will try to shed more light on these three most common operations and try to understand of what happens. For all the evaluation of performance, we have used:

  • Python version 3.6.7,
  • Numpy 1.16.4 and Pandas 0.24.2,
  • Ubuntu 16.04,
  • PC: Intel Core i5-7200U CPU @ 2.50GHz,
  • IPython and %timeit command.

Performance tests

Case 1: Selecting of a subset of data

As for the first case, we select a subset of positive values from a uniformly randomly generated data. Furthermore, we organize the data in form of an numpy array and pandas data frame as either 1-dimentional object of the size of or 2-dimentional array with size of , where is the number of elements. For every , we test the following operations:

1
2
3
4
5
6
7
8
9
10
11
12
13
14
15
16
17
if DIM == 1:
    npx = np.random.randn(N)
else:
    N = int(N**0.5)
    npx = np.random.randn(N, N)
dfx = pd.DataFrame(npx)

%timeit [x > 0 for x in npx]                # explicit loop (DIM == 1)
%timeit [x > 0 for x in [y for y in npx]]   # explicit loop (DIM == 2)

%timeit npx > 0                             # numpy
%timeit np.where(npx > 0, True, False)      # np.where
%timeit dfx > 0                             # dataframe
%timeit dfx.applymap(lambda x: x > 0)       # applymap
%timeit dfx.apply(lambda x: x > 0, axis=0)  # apply, axis=0
%timeit dfx.apply(lambda x: x > 0, axis=1)  # apply, axis=1
%timeit dfx.pipe(lambda x: x > 0)           # pipe
/assets/data-science-computation-harakiri/condition.png 
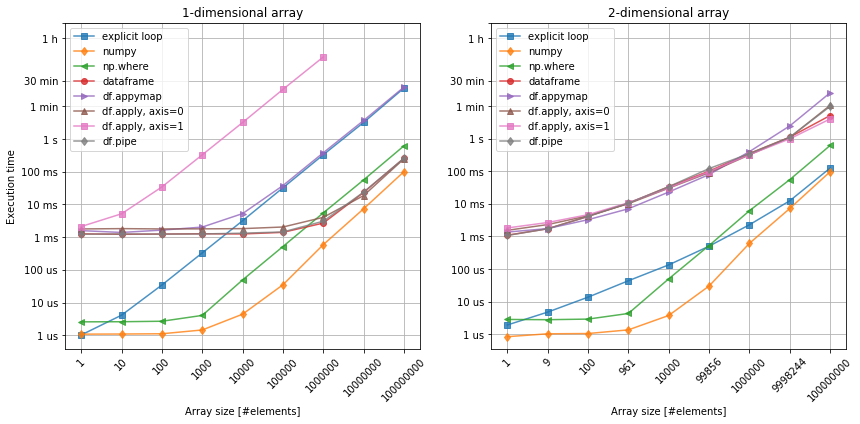
Figure 1. Selecting a data subset. Left: 1-dimensional array. Right: 2-dimensional array.

First of all, numpy is by all means the fastest. The reason for that it is C-compiled and stores numbers of the same type (see here), and in contrast to the explicit loop, it does not operate on pointers to objects. The np.where function is a common way of implementing element-wise condition on an numpy array. It often comes in handy, but it does come with a small performance price that is related to an overhead of a function call.

When it comes to the pandas dataframes, their main advantage is the ability to store associated data of different types, which improves both the process of data analysis and code readablility. At the same time, this flexibility is also the main disadvantage of the dataframes when it comes to performance. Looking at the figure 1, we can see that irrespectively of the array size, there is an initial price of 1ms to pay just invoke the calculations. Then, the rest only depends on the array size and… arrangement of its elements!

The x > 0 is a very simple condition that can be applied to any numerical data. Since all our date elements are numbers, it is possible to apply it on all rows (df.apply(..., axis=0), columns (df.apply(..., axis=1)), element-wise (df.applymap) or over the entire dataframe (df.pipe), and so it gives us good way of testing. Comparing 1-dimensional array with 2-dimensional one, we can instanly spot the importance of the axis argument in apply method. Although, our data may not always allow us to choose between these methods, we should try to vectorize along the the shortest axis (columns in this case). If the number of columns and rows are comparable, then df.applymap or df.pipe are better choices.

Last, but not least, it can be noticed that the shape of the array also influences the scaling. Except from numpy (after the initial constant), the execution time on the dataframes is not linear. Still, the possible cross-over between the execution time related to numpy and pandas methods seems to occur in the region of at least elements, which is where cloud computing comes in.

Case 2: Applying atomic function to data

Now, let’s see what it takes to apply a simple atomic calculation: taking a square root of every number. In order to avoid getting into complex numbers, let us use only positive numbers. Furthermore, we introduce vsqrt - a vectorized version of the sqrt function (but not equivalent to np.sqrt) in order to account for the case of bringing a foreign function into numpy. Finally, let’s see the difference between calling sqrt through .apply directly, or through a lambda.

We test the following functions:

1
2
3
4
5
6
7
8
9
10
11
12
13
14
15
16
17
18
19
20
21
if DIM == 1:
    npx = np.random.random((N, 1))
else:
    N = int(N**0.5)
    npx = np.random.random((N, N))
dfx = pd.DataFrame(npx)

def sqrt(x):
    return x**0.5

vsqrt = np.vectorize(sqrt)

%timeit [sqrt(x) for x in npx]                  # explicit loop (DIM == 1)
%timeit [sqrt(x) for x in [y for y in npx]]     # explicit loop (DIM == 2)
%timeit sqrt(npx)                               # numpy
%timeit vsqrt(npx)                              # np.vectorize
%timeit dfx.applymap(sqrt(x))                   # df.applymap
%timeit dfx.apply(sqrt, axis=0)                 # df.apply, axis=0
%timeit dfx.apply(sqrt, axis=1)                 # df.apply, axis=1
%timeit dfx.apply(lambda x: sqrt(x), axis=0)    # df.apply, axis=0, as lambda
%timeit dfx.apply(lambda x: sqrt(x), axis=1)    # df.apply, axis=1, as lambda
/assets/data-science-computation-harakiri/functions.png 
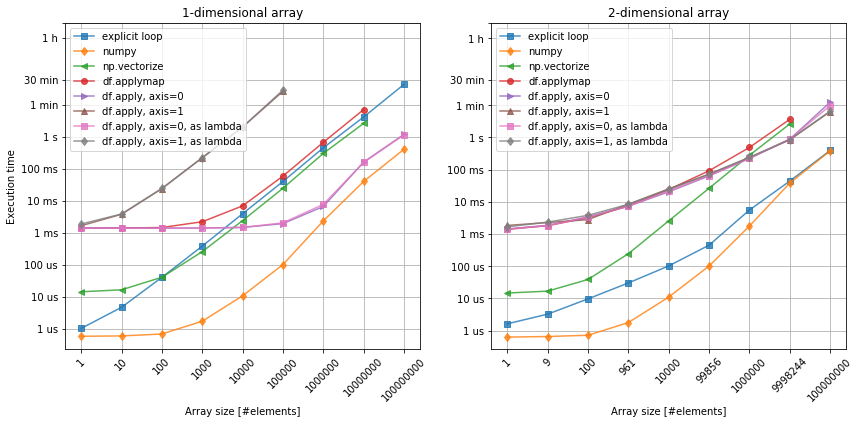
Figure 2. Applying a function to the data. Left: 1-dimensional array. Right: 2-dimensional array.

Again, bare-bone numpy beats all the other methods. We can also see the similar behavior of pandas dataframe objects, as comparing with the previous case.

Interestingly, however the vectorized form of the square root function, seems to underperform comparing to the explicit loop. While nearly the same for the 1-dimensional array, for the 2-dimensional case it performs far worse than the loop and even wose than pandas. Perhaps it does make sense, if the original function is relatively more complex, continaing mutliple loops and conditions? Anyway, it seems to be more efficient to just construct function that can be applied directly on the numpy arrays.

Finally, figure 2. shows there is no practical difference between calling df.apply method using lambda or directly. The anonymouns function does offer more flexibiluity (when x becomes row or column), but there is no penalty here.

Case 3: Vector-matrix multiplication

Finally, the last case in this post touches one of the most common numerical operations: calculating a dot-product between a vector and a matrix. Mathematically, this operation can be defined as , where every element of is calculated by taking

,

times, which for array, gives rise to multiplications and additions.

Taking pandas aside for now, numpy already offers a bunch of functions that can do quite the same.

  • np.dot - generic dot product of two arrays,
  • np.matmul - treating all arrays’ elements as matrices,
  • np.inner - alternative to np.dot, but reduced in flexibility,
  • np.tensordot - the most generic (generialized to tensors) dot product.

For simplicity, we use a square matrix and compute the product of the following dinemsionality: , yielding operations.

1
2
3
4
5
6
7
8
9
10
11
12
13
14
15
A = np.random.randn(N, N)
X = np.random.randn(N)

def naive(A, X):
    Y = np.zeros(A.shape[1])
    for i in range(A.shape[0]):
        for j in range(A.shape[1]):
            Y[j] += A[i, j]*X[i]
    return Y

%timeit naive(A, X)
%timeit np.dot(A, X)
%timeit np.matmul(A, X)
%timeit np.inner(A, X)
%timeit np.tensordot(A, X, axes=1)
/assets/data-science-computation-harakiri/vmmul.png 
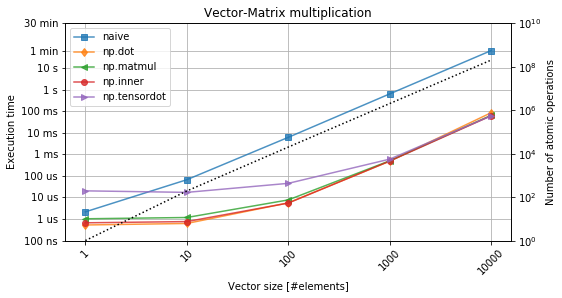
Figure 3. Vector-matrix multiplication. The black-dotted line denotes the number of operations.

From figure 3, it is evident that custom-made loop-based implementation performs worse by even three orders of magnitude. At the same time, there is no real differnece between the different variants of the dot-product as listed above. The initial flat characteristics can be explained with a penalty associated with a function call itself. The more complicated the function (e.g. np.tensordot), the higher it becomes. However, as soon as the numbers are relatively larger, the execution time is dominated by the actual computation time, which becomes agnosic to the intial funtion.

Conclusions

Having studies the three cases, the following pieces of advice make sense:

  • Always use numpy for math and avoid “naive computing”.
  • Use preferebly numpy native methods if they exist.
  • If they don’t, at least try to encapulate your data in numpy arrays.
  • If pandas dataframes are used, make use of apply, applymap and pipe.
  • Bare in mind, however, that the shape of a dataframe stongly influences the permance of especially apply method.

So… is your code still running slowly? Look it up again! Maybe it’s not time to move from python to C just yet? Perhaps there is still a method or two that slow the whole thing down, or you have even made a computation hara-kiri?


from Planet Python
via read more

ListenData: Python : How to read CSV file with pandas

This tutorial explains how to read a CSV file in python using read_csv function of pandas package. Without use of read_csv function, it is not straightforward to import CSV file with python object-oriented programming. Pandas is an awesome powerful python package for data manipulation and supports various functions to load and import data from various formats. Here we are covering how to deal with common issues in importing CSV file.
Table of Contents

Install and Load Pandas Package
Make sure you have pandas package already installed on your system. If you set up python using Anaconda, it comes with pandas package so you don't need to install it again. Otherwise you can install it by using command pip install pandas. Next step is to load the package by running the following command. pd is an alias of pandas package. We will use it instead of full name "pandas".
import pandas as pd
Create Sample Data for Import
The program below creates a sample pandas dataframe which can be used further for demonstration.

dt = {'ID': [11, 12, 13, 14, 15],
'first_name': ['David', 'Jamie', 'Steve', 'Stevart', 'John'],
'company': ['Aon', 'TCS', 'Google', 'RBS', '.'],
'salary': [74, 76, 96, 71, 78]}
mydt = pd.DataFrame(dt, columns = ['ID', 'first_name', 'company', 'salary'])
The sample data looks like below -

ID first_name company salary
0 11 David Aon 74
1 12 Jamie TCS 76
2 13 Steve Google 96
3 14 Stevart RBS 71
4 15 John . 78
Save data as CSV in the working directory
Check working directory before you save your datafile.

import os
os.getcwd()
Incase you want to change the working directory, you can specify it in under os.chdir( ) function. Single backslash does not work in Python so use 2 backslashes while specifying file location.

os.chdir("C:\\Users\\DELL\\Documents\\")
The following command tells python to write data in CSV format in your working directory.

mydt.to_csv('workingfile.csv', index=False)

Example 1 : Read CSV file with header row

It's the basic syntax of read_csv() function. You just need to mention the filename. It assumes you have column names in first row of your CSV file.

mydata = pd.read_csv("workingfile.csv")
It stores the data the way It should be as we have headers in the first row of our datafile. It is important to highlight that header=0 is the default value. Hence we don't need to mention the header= parameter. It means header starts from first row as indexing in python starts from 0. The above code is equivalent to this line of code. pd.read_csv("workingfile.csv", header=0)
Inspect data after importing

mydata.shape
mydata.columns
mydata.dtypes
It returns 5 number of rows and 4 number of columns. Column Names are ['ID', 'first_name', 'company', 'salary']

See the column types of data we imported. first_name and company are character variables. Remaining variables are numeric ones.


ID int64
first_name object
company object
salary int64

Example 2 : Read CSV file with header in second row

Suppose you have column or variable names in second row. To read this kind of CSV file, you can submit the following command.
mydata = pd.read_csv("workingfile.csv", header = 1)
header=1 tells python to pick header from second row. It's setting second row as header. It's not a realistic example. I just used it for illustration so that you get an idea how to solve it. To make it practical, you can add random values in first row in CSV file and then import it again.

11 David Aon 74
0 12 Jamie TCS 76
1 13 Steve Google 96
2 14 Stevart RBS 71
3 15 John . 78
Define your own column names instead of header row from CSV file

mydata0 = pd.read_csv("workingfile.csv", skiprows=1, names=['CustID', 'Name', 'Companies', 'Income'])
skiprows = 1 means we are ignoring first row and names= option is used to assign variable names manually.

CustID Name Companies Income
0 11 David Aon 74
1 12 Jamie TCS 76
2 13 Steve Google 96
3 14 Stevart RBS 71
4 15 John . 78

Example 3 : Skip rows but keep header


mydata = pd.read_csv("workingfile.csv", skiprows=[1,2])
In this case, we are skipping second and third rows while importing. Don't forget index starts from 0 in python so 0 refers to first row and 1 refers to second row and 2 implies third row.

ID first_name company salary
0 13 Steve Google 96
1 14 Stevart RBS 71
2 15 John . 78

Instead of [1,2] you can also write range(1,3). Both means the same thing but range( ) function is very useful when you want to skip many rows so it saves time of manually defining row position.

Hidden secret of skiprows option

When skiprows = 4, it means skipping four rows from top. skiprows=[1,2,3,4] means skipping rows from second through fifth. It is because when list is specified in skiprows= option, it skips rows at index positions. When a single integer value is specified in the option, it considers skip those rows from top

Example 4 : Read CSV file without header row

If you specify "header = None", python would assign a series of numbers starting from 0 to (number of columns - 1) as column names. In this datafile, we have column names in first row.
mydata0 = pd.read_csv("workingfile.csv", header = None)
See the output shown below-
Output
Add prefix to column names
mydata0 = pd.read_csv("workingfile.csv", header = None, prefix="var")
In this case, we are setting var as prefix which tells python to include this keyword before each column name.

var0 var1 var2 var3
0 ID first_name company salary
1 11 David Aon 74
2 12 Jamie TCS 76
3 13 Steve Google 96
4 14 Stevart RBS 71
5 15 John . 78

Example 5 : Specify missing values

The na_values= options is used to set some values as blank / missing values while importing CSV file.

mydata00 = pd.read_csv("workingfile.csv", na_values=['.'])

ID first_name company salary
0 11 David Aon 74
1 12 Jamie TCS 76
2 13 Steve Google 96
3 14 Stevart RBS 71
4 15 John NaN 78

Example 6 : Set Index Column


mydata01 = pd.read_csv("workingfile.csv", index_col ='ID')

first_name company salary
ID
11 David Aon 74
12 Jamie TCS 76
13 Steve Google 96
14 Stevart RBS 71
15 John . 78
As you can see in the above output, the column ID has been set as index column.

Example 7 : Read CSV File from External URL

You can directly read data from the CSV file that is stored on a web link. It is very handy when you need to load publicly available datasets from github, kaggle and other websites.

mydata02 = pd.read_csv("http://winterolympicsmedals.com/medals.csv")
This DataFrame contains 2311 rows and 8 columns. Using mydata02.shape, you can generate this summary.

Example 8 : Skip Last 5 Rows While Importing CSV


mydata04 = pd.read_csv("http://winterolympicsmedals.com/medals.csv", skip_footer=5)
In the above code, we are excluding bottom 5 rows using skip_footer= parameter.

Example 9 : Read only first 5 rows


mydata05 = pd.read_csv("http://winterolympicsmedals.com/medals.csv", nrows=5)
Using nrows= option, you can load top K number of rows.

Example 10 : Interpreting "," as thousands separator


mydata06 = pd.read_csv("http://winterolympicsmedals.com/medals.csv", thousands=",")

Example 11 : Read only specific columns


mydata07 = pd.read_csv("http://winterolympicsmedals.com/medals.csv", usecols=[1,5,7])
The above code reads only columns based on index positions which are second, sixth and eighth position.

Example 12 : Read some rows and columns


mydata08 = pd.read_csv("http://winterolympicsmedals.com/medals.csv", usecols=[1,5,7], nrows=5)
In the above command, we have combined usecols= and nrows= options. It will select only first 5 rows and selected columns.

Example 13 : Read file with semi colon delimiter


mydata09 = pd.read_csv("file_path", sep = ';')
Using sep= parameter in read_csv( ) function, you can import file with any delimiter other than default comma. In this case, we are using semi-colon as a separator.

Example 14 : Change column type while importing CSV

Suppose you want to change column format from int64 to float64 while loading CSV file into Python. We can use dtype = option for the same.

mydf = pd.read_csv("workingfile.csv", dtype = {"salary" : "float64"})

Example 15 : Measure time taken to import big CSV file

With the use of verbose=True, you can capture time taken for Tokenization, conversion and Parser memory cleanup.
mydf = pd.read_csv("workingfile.csv", verbose=True)
EndNote
After completion of this tutorial, I hope you gained confidence in importing CSV file into Python with ways to clean and manage file. You can also check out this tutorial which explains how to import files of different format to Python. Once done, you should learn how to perform common data manipulation or wrangling tasks like filtering, selecting and renaming columns, identify and remove duplicates etc on pandas dataframe.


from Planet Python
via read more

ListenData: Importing Data into Python

This tutorial explains various methods to read data into Python. Data can be in any of the popular formats - CSV, TXT, XLS/XLSX (Excel), sas7bdat (SAS), Stata, Rdata (R) etc. Loading data in python environment is the most initial step of analyzing data.
Import Data into Python
While importing external files, we need to check the following points -
  1. Check whether header row exists or not
  2. Treatment of special values as missing values
  3. Consistent data type in a variable (column)
  4. Date Type variable in consistent date format.
  5. No truncation of rows while reading external data

Install and Load pandas Package

pandas is a powerful data analysis package. It makes data exploration and manipulation easy. It has several functions to read data from various sources.

If you are using Anaconda, pandas must be already installed. You need to load the package by using the following command -
import pandas as pd
If pandas package is not installed, you can install it by running the following code in Ipython Console. If you are using Spyder, you can submit the following code in Ipython console within Spyder.
!pip install pandas
If you are using Anaconda, you can try the following line of code to install pandas -
!conda install pandas
1. Import CSV files

It is important to note that a single backslash does not work when specifying the file path. You need to either change it to forward slash or add one more backslash like below
import pandas as pd
mydata= pd.read_csv("C:\\Users\\Deepanshu\\Documents\\file1.csv")
If no header (title) in raw data file
mydata1  = pd.read_csv("C:\\Users\\Deepanshu\\Documents\\file1.csv", header = None)
You need to include header = None option to tell Python there is no column name (header) in data.

Add Column Names

We can include column names by using names= option.
mydata2  = pd.read_csv("C:\\Users\\Deepanshu\\Documents\\file1.csv", header = None, names = ['ID', 'first_name', 'salary'])
The variable names can also be added separately by using the following command.
mydata1.columns = ['ID', 'first_name', 'salary']


2. Import File from URL

You don't need to perform additional steps to fetch data from URL. Simply put URL in read_csv() function (applicable only for CSV files stored in URL).
mydata  = pd.read_csv("http://winterolympicsmedals.com/medals.csv")

3. Read Text File 

We can use read_table() function to pull data from text file. We can also use read_csv() with sep= "\t" to read data from tab-separated file.
mydata = pd.read_table("C:\\Users\\Deepanshu\\Desktop\\example2.txt")
mydata  = pd.read_csv("C:\\Users\\Deepanshu\\Desktop\\example2.txt", sep ="\t")

4. Read Excel File

The read_excel() function can be used to import excel data into Python.
mydata = pd.read_excel("https://www.eia.gov/dnav/pet/hist_xls/RBRTEd.xls",sheetname="Data 1", skiprows=2)
If you do not specify name of sheet in sheetname= option, it would take by default first sheet.

5. Read delimited file

Suppose you need to import a file that is separated with white spaces.
mydata2 = pd.read_table("https://ift.tt/1ICFJqG", sep="\s+", header = None)
To include variable names, use the names= option like below -
mydata3 = pd.read_table("https://ift.tt/1ICFJqG", sep="\s+", names=['a', 'b', 'c', 'd'])
6. Read SAS File

We can import SAS data file by using read_sas() function.
mydata4 = pd.read_sas('cars.sas7bdat')

7. Read Stata File

We can load Stata data file via read_stata() function.
mydata41 = pd.read_stata('cars.dta')
8. Import R Data File

Using pyreadr package, you can load .RData and .Rds format files which in general contains R data frame. You can install this package using the command below -
pip install pyreadr
With the use of read_r( ) function, we can import R data format files.
import pyreadr
result = pyreadr.read_r('C:/Users/sampledata.RData')
print(result.keys()) # let's check what objects we got
df1 = result["df1"] # extract the pandas data frame for object df1
Similarly, you can read .Rds formatted file.
 
9. Read SQL Table

We can extract table from SQL database (Teradata / SQL Server). See the program below -
import sqlite3
from pandas.io import sql
conn = sqlite3.connect('C:/Users/Deepanshu/Downloads/flight.db')
query = "SELECT * FROM flight;"
results = pd.read_sql(query, con=conn)
print results.head()

10. Read sample of rows and columns

By specifying nrows= and usecols=, you can fetch specified number of rows and columns.
mydata7  = pd.read_csv("https://ift.tt/1Xokth4", nrows=5, usecols=(1,5,7))
nrows = 5 implies you want to import only first 5 rows and usecols= refers to specified columns you want to import.

11. Skip rows while importing

Suppose you want to skip first 5 rows and wants to read data from 6th row (6th row would be a header row)
mydata8  = pd.read_csv("https://ift.tt/1Xokth4", skiprows=5)
12. Specify values as missing values

By including na_values= option, you can specify values as missing values. In this case, we are telling python to consider dot (.) as missing cases.
mydata9  = pd.read_csv("workingfile.csv", na_values=['.'])


from Planet Python
via read more

TestDriven.io: Working with Static and Media Files in Django

This article looks at how to work with static and media files in a Django project, locally and in production. from Planet Python via read...